

On the first Friday of most months, at 8:30 a.m. Eastern, a single number moves trillions of dollars. Traders position for it, the Federal Reserve leans on it, campaigns cut ads around it, and the wire services race to publish it within seconds. The number is the monthly change in nonfarm payrolls. In September 2025 the Bureau of Labor Statistics said a preliminary revision had erased 911,000 of the jobs it had reported over the previous year, a figure it would finalize five months later at 898,000. A year earlier it had preliminarily marked down 818,000, later settled at 589,000. Roughly 1.7 million jobs on the first counts, about 1.5 million after the final ones, reported and traded on and argued over, then revised away.
This is a story about jobs report revisions, and it is usually told as a scandal. It is worth telling as something more useful. The headline figure is not a count. It is a survey estimate, and it carries a margin of error most people never see, because the chart never shows it. The number changing is not the problem. Numbers like this always change. The problem is that we drew a provisional estimate as if it were a finished fact.
Where 911,000 jobs went
Once a year the BLS re-anchors its monthly survey to something close to a full census: the unemployment-insurance tax records nearly every employer files, which cover about 95 percent of jobs. That annual re-anchoring is called the benchmark. In September the preliminary benchmark for April 2024 through March 2025 came in at minus 911,000, about six-tenths of a percent of all payrolls. The cut was broad. Private employers accounted for 880,000 of it and government for the remaining 31,000, and no major sector was spared.
As the chart above shows, the damage concentrated where the labor market was actually cooling. Trade, transportation and utilities lost 226,000 jobs on paper, retail and wholesale doing most of the work. Leisure and hospitality gave back 176,000, professional and business services 158,000. The revision did not invent a new economy. It sharpened a picture that had slipped out of focus, turning a benchmark year that had looked like about 147,000 jobs a month into one closer to 71,000 once the 911,000 was spread across it.
This happens every single year
The temptation is to read a number this big as a scandal. It is not. Benchmarking has run since 1949, and a downward or upward revision lands every February. Most years it is small, a rounding adjustment nobody notices. The ten-year average is about two-tenths of a percent. Plotted across recent years, as the chart below shows, the routine is obvious, and so is the exception.
Every year gets a bar, up or down, and most hug the zero line. The 2025 benchmark, finalized at minus 898,000 in February 2026, is the largest in the comparable record, back to 2002, and roughly three times the norm. One analyst who tracks the series called it "higher than usual, though not extreme," which is exactly right. It is an outlier in size and an ordinary event in kind, and it began well before the current administration, under methods that have not changed.
The benchmark itself is not final when it lands. It is first published as a preliminary estimate in the summer and only finalized the following winter, and the preliminary is often wrong too. The 2024 benchmark was first announced as minus 818,000 and finalized at minus 589,000, a swing of 229,000 in the correction alone.
Even the correction gets corrected. The chart above pairs each preliminary estimate against its final, and the lesson is not that BLS is unreliable. It is that a first estimate, at any stage, is a draft.
The monthly prints wobble, but not more than usual
The benchmark is an annual event. The monthly report has its own smaller revisions, and 2025 delivered a run of ugly ones. The number for a given month is published, then revised in each of the next two reports as more survey responses arrive. In the summer of 2025 those monthly jobs report revisions turned brutal, as the chart below shows.
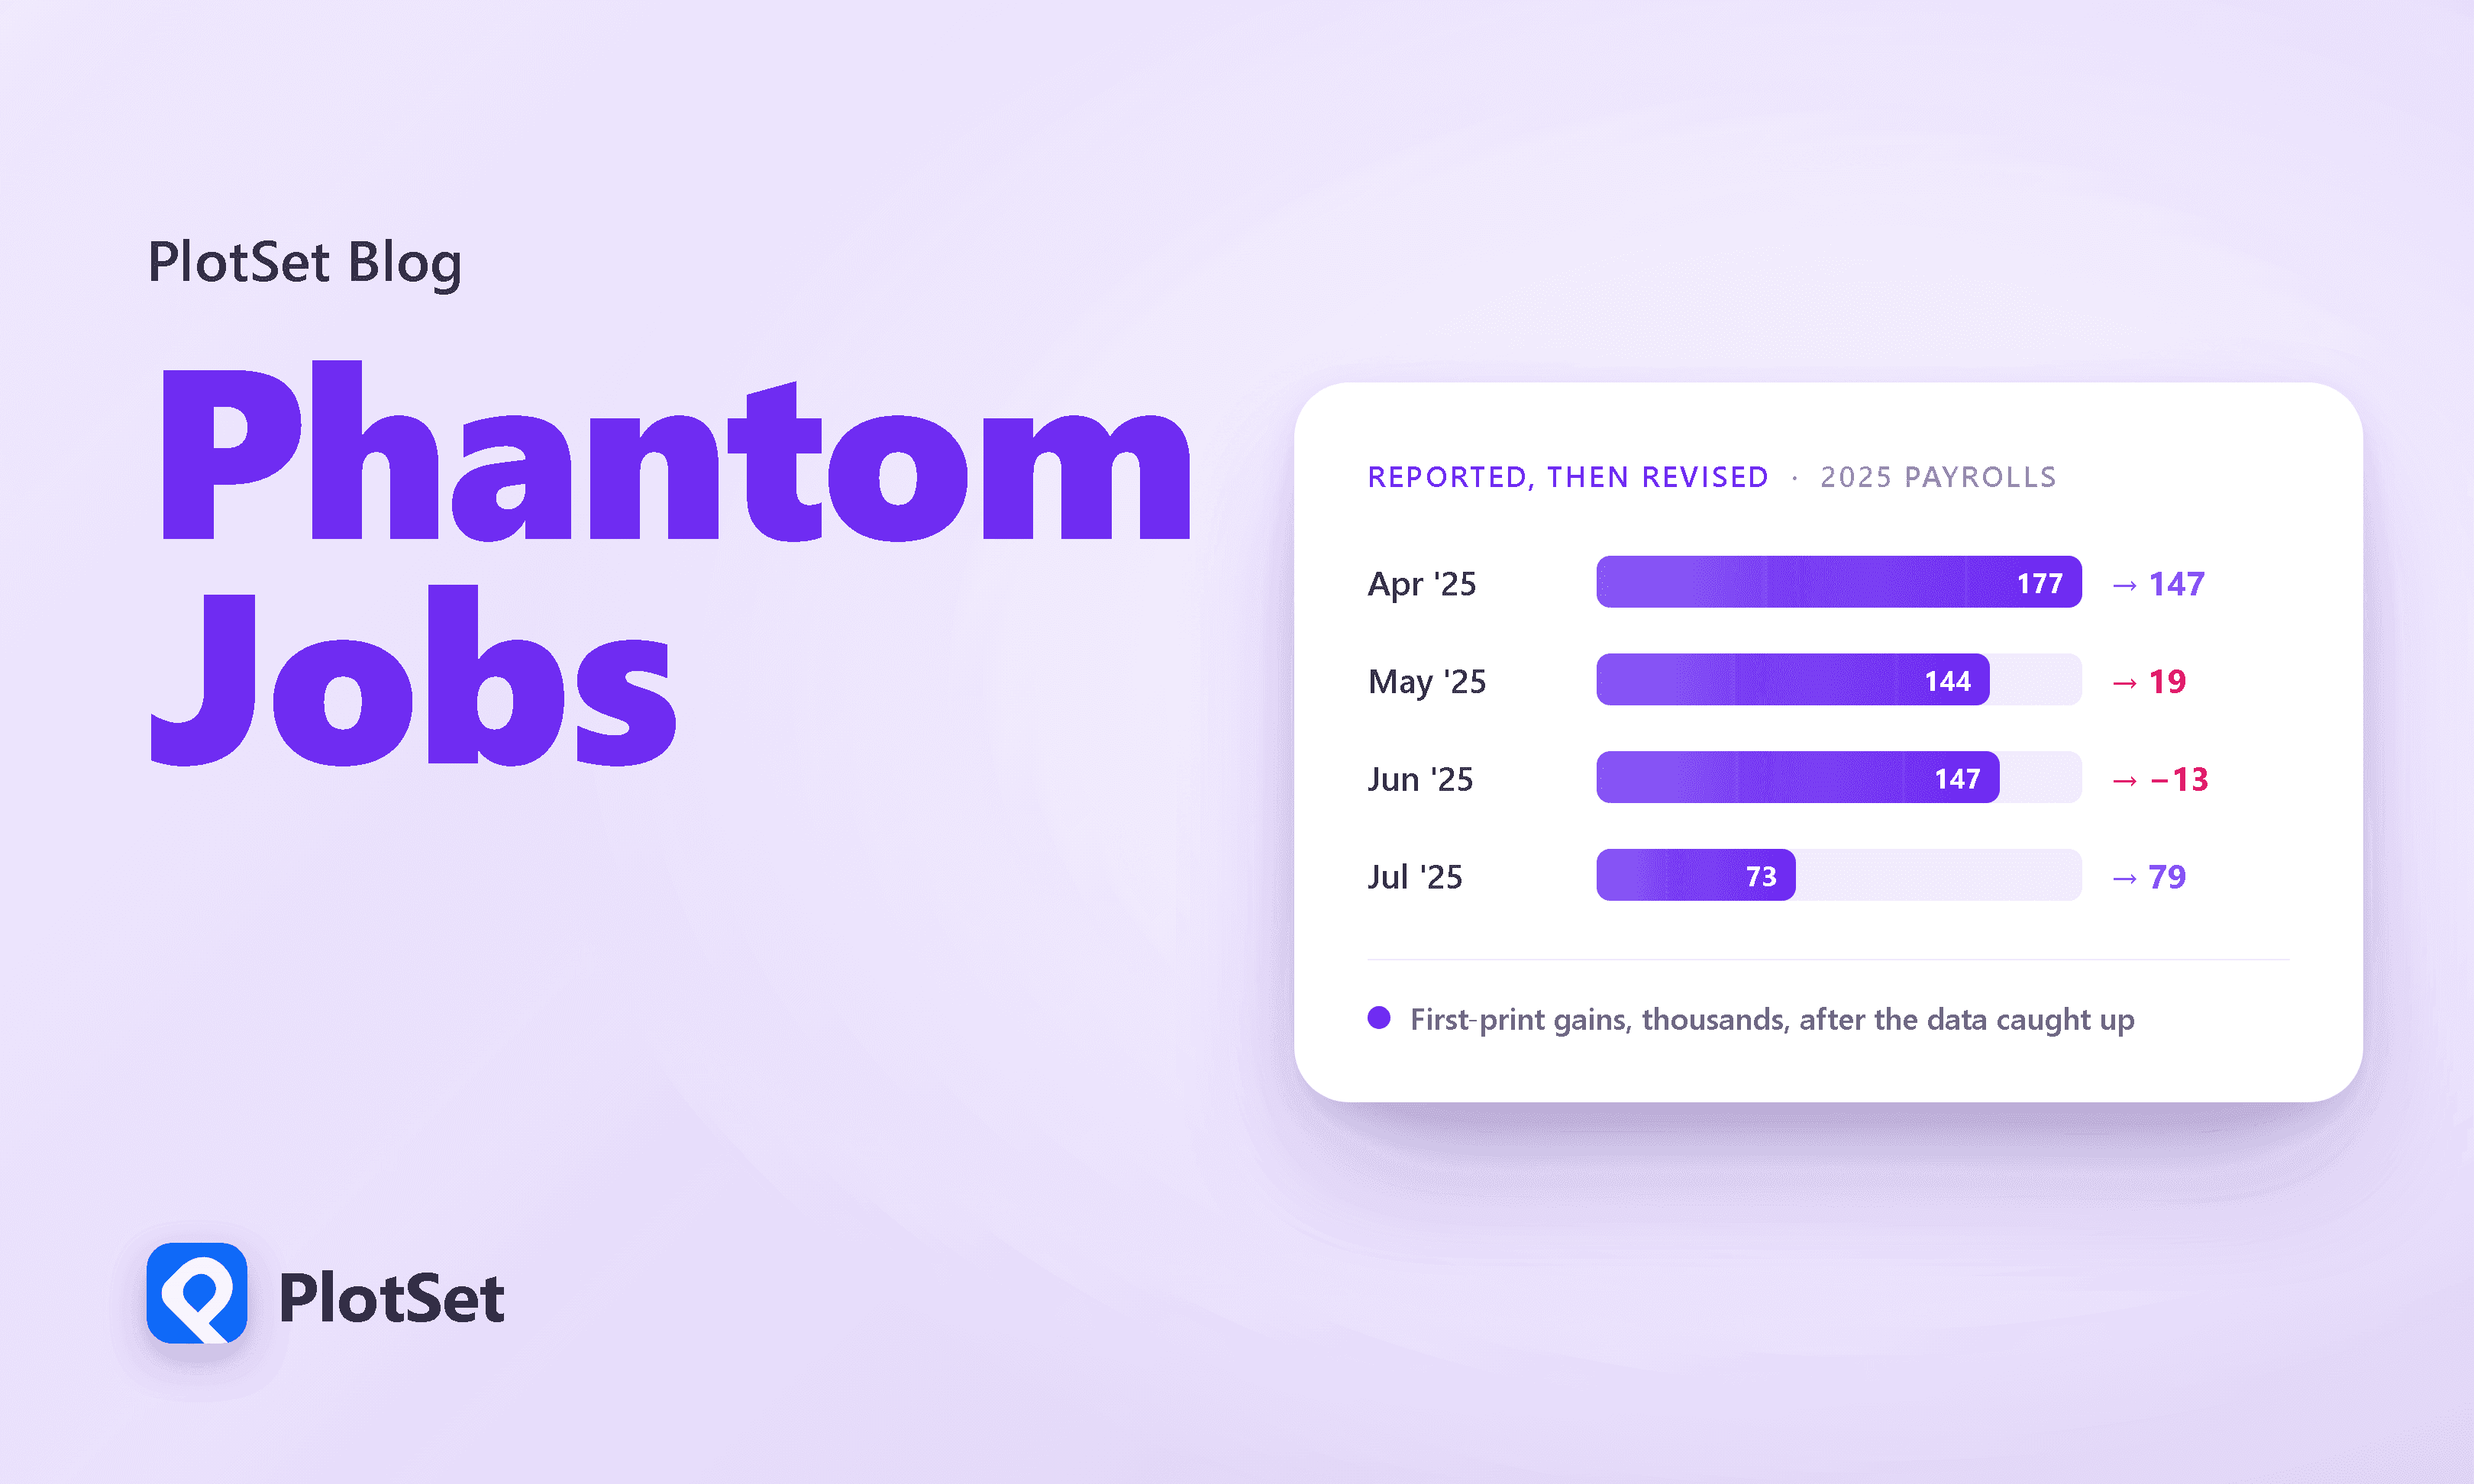
May was first reported as a gain of 144,000 and cut to 19,000. June's reported 147,000 was first cut to 14,000, and by the August report the two months had been marked down by a combined 258,000. A month later, in the September release, June was revised once more, to a loss of 13,000. A reported gain had become an outright decline. These revisions are real, and they are large.
But the obvious conclusion here is exactly wrong. It would be easy to say the monthly data is falling apart. It is not. Measure the average size of the monthly revisions across nearly half a century and, as the chart below shows, 2025 looks unremarkable.
The mean monthly revision in 2025 was about 53,000, right on the long-run average of roughly 51,000 since 2003. The genuine anomaly on that line is the pandemic, when 2021 revisions averaged 181,000. The Federal Reserve Bank of San Francisco has made the same point: the size of monthly revisions since 2022 is in line with the decades before it. What changed in 2025 was the direction, a steady drip downward as a cooling economy revealed itself, not the magnitude. The big number is the annual benchmark. The monthly noise is just noise, and about the usual amount of it.
The number was never a fact
All of this follows from a single detail the charts omit. The monthly payroll figure is drawn from a survey of about 119,000 businesses covering roughly a quarter of all jobs, collected on a deadline that about four in ten respondents miss on the first pass. It is an estimate, and BLS is admirably honest about how rough an estimate it is. The 90 percent confidence interval on the monthly change is about plus or minus 122,000 jobs. In plain terms, a reported gain of 50,000 is not statistically distinguishable from a loss.
Each row shows the range a monthly print could plausibly occupy. When the reported gain is small, the range straddles zero, which means the honest answer to "did the economy add jobs that month?" is often "we cannot tell yet." Calendar 2025, after the final benchmark, averaged only 15,000 jobs a month, which for long stretches made the monthly gain statistically a coin flip. And the fuzziness compounds the moment you slice the data thinner, because a smaller sample carries a larger relative error.
For total payrolls the sampling error is about a tenth of a percent. For mining and logging it is sixteen times that. The confident little bar in a sector chart is often the least reliable number on the page.
Why did the annual benchmark move so much more than the monthly noise? Part of the answer is that fewer employers answer the survey in time than used to. The share responding by the first deadline has slid from around three-quarters a decade ago to about 60 percent in 2024, though roughly 91 percent are eventually counted. A thinner early sample drifts further from the truth over a year, and each spring the benchmark re-anchors that drifting estimate to the near-complete tax records. Bigger accumulated drift, bigger benchmark. It is a resourcing and response problem, not a manipulation, and it argues for funding the statistical agencies better, not trusting them less.
The politics, and why they are beside the point
By 2025 the numbers had curdled into a political weapon, and the fight is worth meeting head on. The BLS commissioner was dismissed in August 2025 after a weak jobs report carried those large downward revisions, and the numbers became a partisan weapon. It is worth being precise, because precision is the whole point. Revisions are a documented feature of the system, running for decades across administrations of both parties. Former BLS commissioners appointed by both parties, along with the American Statistical Association, said as much plainly: benchmarking makes the data more accurate, and a large revision reflects measurement lag and a cooling labor market, not fabrication. A revision is the system working, not failing.
The actual crime is the chart
Strip away the politics and a real failure remains, and it is one of design. Every payroll chart you saw during those months plotted the first estimate as a solid, definitive bar, with no hint that the number was provisional and no sign of the plus-or-minus-122,000 band that BLS prints right there in the release text. The chart said "147,000 jobs, full stop." The data said "somewhere around 147,000, we will know better in a month, and in a year." Those are different claims, and only one of them was true.
The fix is not complicated, and statistical agencies already know it. The UK's Office for National Statistics tells its own analysts to show uncertainty directly: a shaded band around a time series, a provisional stretch drawn as a dashed line rather than a solid one, first-print and final numbers shown as paired bars so the reader can see the estimate move. The Bank of England has published its forecasts as fan charts, all uncertainty and no false edges, since 1996. Every technique needed to draw an honest jobs chart has existed for thirty years.
The monthly payroll number will keep moving markets in the seconds after 8:30. It should, within reason, because it is the best fast read we have on the economy. But a fast read is a provisional one, and a chart that hides that is not being clear, it is being wrong in a way that happens to look authoritative. The 911,000 jobs were never really there to lose. The honest chart would have told you they might not be.
References
- U.S. Bureau of Labor Statistics. 2025 CES Preliminary Benchmark Revision. The minus 911,000 preliminary benchmark for April 2024 to March 2025, the private and government split, and the by-sector breakdown.
- U.S. Bureau of Labor Statistics. The Employment Situation (final 2025 benchmark). The final minus 898,000 benchmark released February 2026 and the two-year 1.03 million downward reduction.
- U.S. Bureau of Labor Statistics. CES National Benchmark Article. The history of annual benchmark revisions and the roughly 0.2 percent long-run average.
- U.S. Bureau of Labor Statistics. Current Employment Statistics Technical Notes. The plus-or-minus-122,000 confidence interval, the sample of about 119,000 firms, and the sampling errors by industry.
- U.S. Bureau of Labor Statistics. Revisions between over-the-month estimates, 1979 to present. The mean absolute monthly revision series behind the near-half-century line chart.
- U.S. Bureau of Labor Statistics. CES survey collection and response rates. The fall in first-deadline collection to about 60 percent versus 91 percent by the final close.
- Wolf Street. Growth of Nonfarm Jobs in 2024 and 2025 Much Weaker than Previously Reported. The final minus 898,000, the "higher than usual, though not extreme" framing, and the 15,000-a-month 2025 average.
- The Hill. Stunning revisions show US added 258K fewer jobs than first reported. May and June 2025 revised down by a combined 258,000 in the August 1 report.
- U.S. Bureau of Labor Statistics. The Employment Situation, August 2025 (September 5, 2025 release). The September revision that cut June 2025 payrolls to an outright loss of 13,000.
- Congressional Research Service. Current Employment Statistics Monthly Revisions (IF13084). The roughly 51,000 since-2003 average revision and the survey collection-stage mechanics.
- Federal Reserve Bank of San Francisco. Economic Letter on CES response rates. The decline in survey response and the finding that revision size since 2022 is in line with prior decades.
- Reuters. US job growth revised down by 818,000 through March 2024. The minus 818,000 preliminary that finalized near minus 589,000.
- Friends of the BLS. Statements defending BLS statistical integrity. Bipartisan former-commissioner and statistician affirmations that revisions are routine and not manipulation.
- UK Office for National Statistics. Showing uncertainty in charts (Service Manual). Official guidance on shaded uncertainty bands, provisional-versus-final treatment, and fan charts.


