Why Choose PlotSet?
The professional chart and graph maker for data analysts, marketers, educators, and designers who need powerful dashboards and stunning visuals.
User-Friendly Interface
Craft stunning charts and maps without writing a single line of code. PlotSet offers an intuitive platform with a wide array of templates, enabling users to focus on storytelling rather than technicalities.


Professional Templates
Start instantly with over 300 customizable chart templates. We cover everything from bar graphs and pie charts for reports, to advanced heat-maps, tree-maps, and scatter plots for data analysis. Plus, create engaging animated video charts for social media.
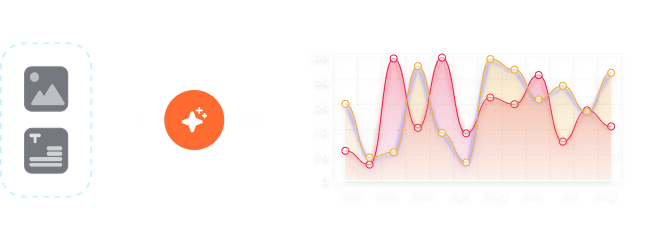
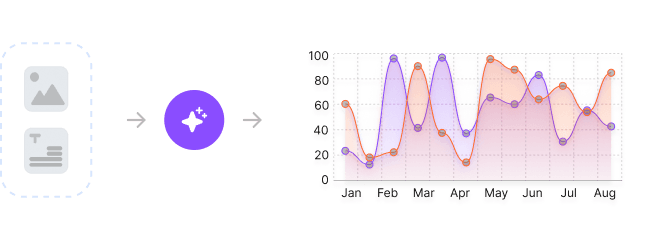
AI-Powered Visualization
Leverage advanced AI features like SnapChart AI and Text-to-Chart to automate chart creation. Simply upload your data or describe your desired visualization, and let PlotSet handle the rest.
How PlotSet Works
PlotSet empowers professionals across various fields to convert complex data into compelling visual stories.


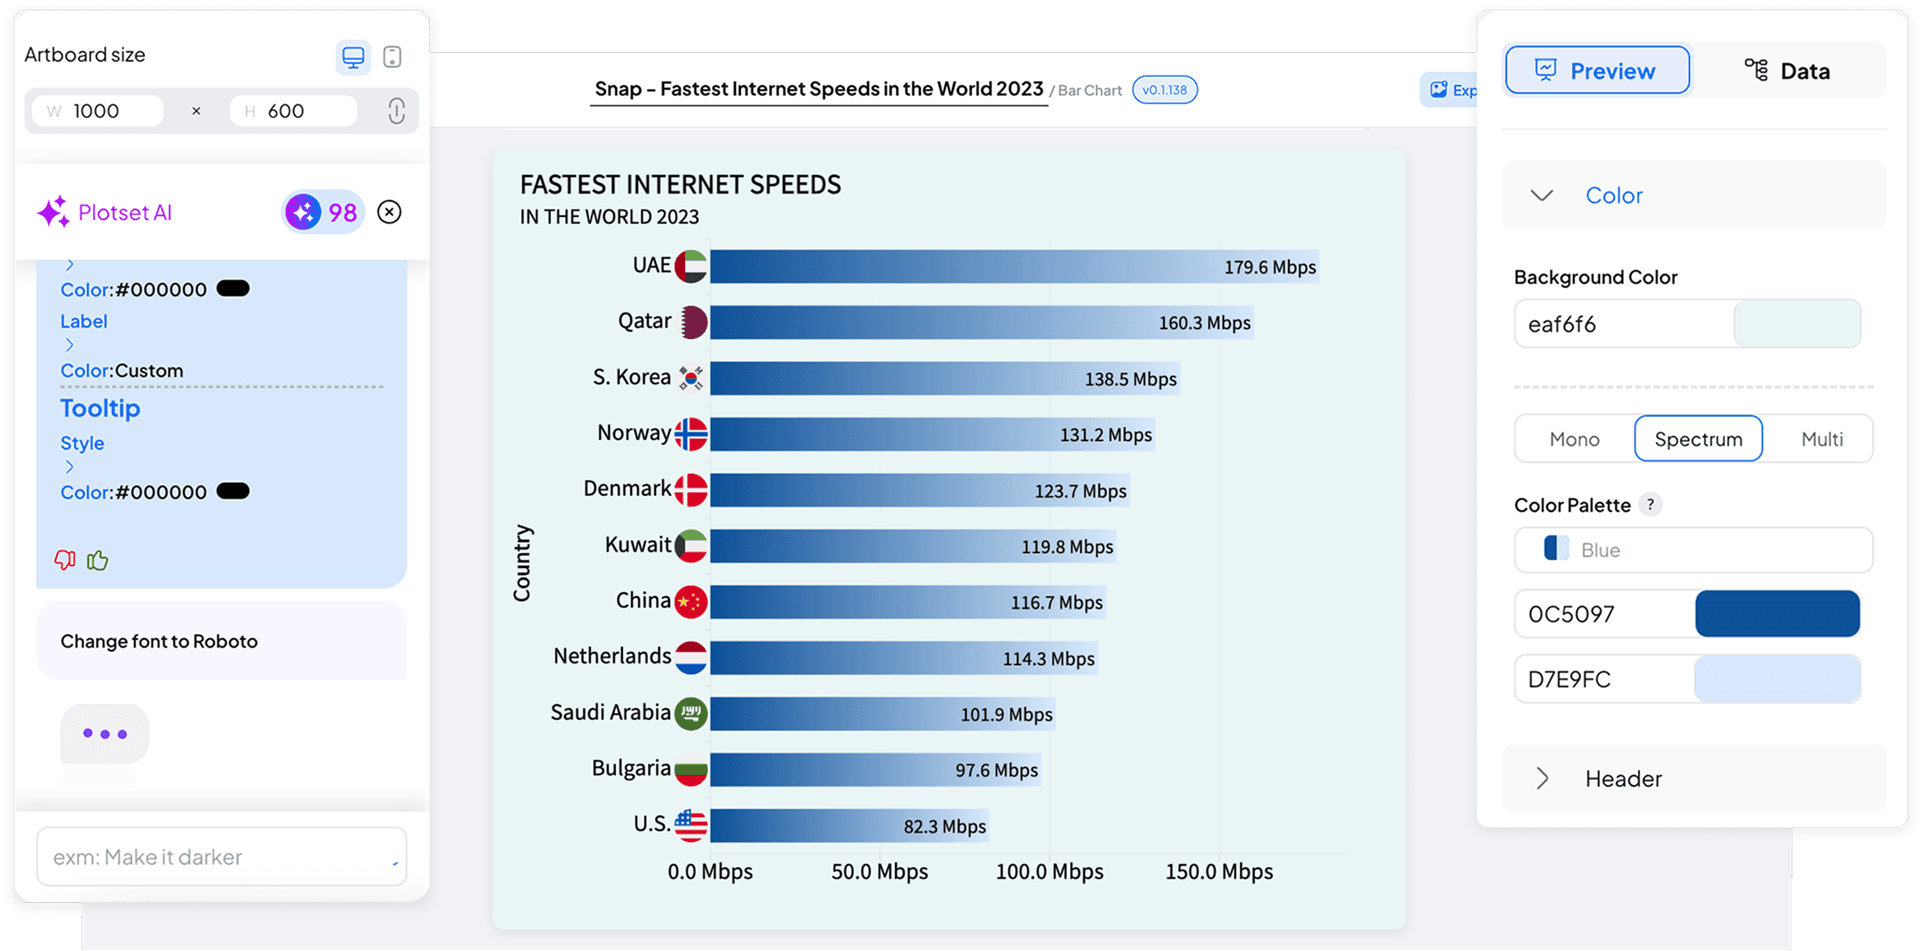
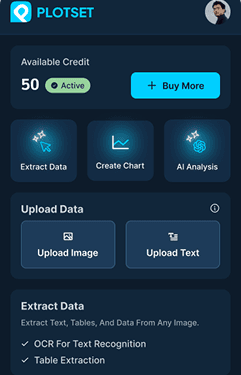
Upload and Convert
Upload your CSV, Excel file, Google Sheet, or even an image. Our AI instantly converts your raw data into an interactive visualization, ready for you to customize in real-time.


Type and Generate
Just describe the chart you need in plain English. Use prompts like "create a histogram for sales data" or "bar graph showing revenue comparison." Our AI understands your request, suggests options, and generates the perfect chart instantly.


Build from Scratch
Start from our library of 300+ templates or a blank canvas. Take full control over layout, colors, fonts, labels, and animations. When you're done, export your visualization as a PNG, SVG, PDF, or MP4 video.
PlotSet Tools and Integrations
Use PlotSet wherever you work, from your browser to your design tools.
PlotSet Chrome Extension
Turn web data into charts instantly. Capture tables and data from any website and visualize it with a single click. Perfect for on-the-fly data analysis, competitor research, and content creation.
Ready to Transform Your Data Storytelling?
Join +6,000 creating stunning charts and video visuals with the all-in-one AI data visualization platform.
PlotSet helps data analysts, marketers, and designers transform complex data into clear, compelling stories. start creating today.
Substack
Join our Substack community to share ideas and learn from fellow data visualization enthusiasts.

Discord
Collaborate with creators and data enthusiasts on our Discord server for real-time collaboration.