| Region | Channel | Revenue |
|---|---|---|
| North America | Direct | 420000 |
| North America | Reseller | 180000 |
| North America | Online | 90000 |
| Europe | Direct | 260000 |
| Europe | Reseller | 140000 |
| Europe | Online | 70000 |
| Asia Pacific | Direct | 150000 |
| Asia Pacific | Reseller | 110000 |
| Asia Pacific | Online | 95000 |
How to Create a Marimekko Chart
A step by step walkthrough for turning a segment, subdivision and value spreadsheet into a published Marimekko chart in PlotSet, from shaping the sheet to locking the stack order and exporting.
约 8 分钟Take a spreadsheet shaped as segment, subdivision and value, something like revenue by region and sales channel, and this guide shows how to create a Marimekko chart in PlotSet where the column widths carry as much information as the stacks inside them. You will shape the sheet, upload it, lock the column order and the stacking order, then publish, embed or export the finished chart.
If your data is already three columns, one row per block, this takes about eight minutes, and most of that goes into locking the stacking order so it reads the same in every column rather than fighting the upload. Add another five if you are unpivoting a wide report, one column per channel, into the long format PlotSet expects.
你需要的数据
Three columns, one row per block: the segment name, the subdivision name, then the number. No totals row, no wide pivot table, one header row.
This is long format: one row per segment-subdivision pair, not one column per subdivision. If your report has a Direct column, a Reseller column and an Online column side by side, restack those into rows before uploading.
Spell each segment name identically on every row. "APAC" on one row and "Asia Pacific" on another reads as two separate segments and splits a total that should be one column.
Delete any totals or subtotals row before uploading. A grand total uploaded as a row becomes a segment of its own and throws off every width.
Keep the value column numeric. A revenue figure stored as text (a stray currency symbol or thousands separator that survived an export) will not sum into the segment total PlotSet uses to calculate column width.
操作步骤
PlotSet 中从空白模板到完成图表的具体点击路径。
- 01
Start a new project on the Marimekko Chart template
From the PlotSet dashboard, start a new project and choose the Marimekko Chart template. It loads with sample data already bound to segment, subdivision and value, so you can see the exact column layout before touching your own file.

每份指南都从这里开始:先选分类,再选模板,不管你要做哪种图表,用的都是同一个网格。 - 02
Shape your sheet into three columns
List one row per block: the segment name first (region), the subdivision name second (channel), and the number third (revenue). This is long format, not the wide pivot table most reporting tools export by default, where each channel gets its own column.
- 03
Unpivot a wide report if that is where you are starting
If your source is a table with one column per subdivision, say a region row with a Direct, Reseller and Online column each, stack those columns into rows instead: one row per region-channel pair, three columns total. A quick copy-paste rebuild handles this faster than it sounds.
- 04
Upload your file or connect a sheet
Use the data panel to import a CSV or .xlsx file, paste rows directly from a spreadsheet, or connect a Google Sheet so the chart can pick up later edits without a re-upload. PlotSet reads the first row as headers automatically.

这里的数据视图取自一个条形图项目。你可以上传 CSV、用「Magic Import」从图片里提取数字,或同步 Google Sheet,每种图表类型的面板都一样。 - 05
Map the segment, subdivision and value columns
Confirm which column feeds the column width (segment), which feeds the stack (subdivision), and which feeds the block size (value). Column widths are calculated for you from the segment totals: you never enter a width directly.

绑定决定哪一列作标签、哪一列提供数值、哪一列决定颜色。「Auto Binding」(自动绑定)会根据表头推测,所以要核对一遍,别想当然。 - 06
Order the columns and lock the stacking order
Sort columns widest to narrowest so the biggest segment reads first, left to right. Then set the subdivision order once and keep it identical in every column: if Direct sits at the bottom in North America, it needs to sit at the bottom in Europe and Asia Pacific too, or the chart stops being comparable across columns.
- 07
Turn on the top axis and value labels
Switch on the cumulative top axis so the segment widths are readable instead of just implied by eye. Add value or percentage labels to each block; without them a reader has to estimate two dimensions at once, which is the main thing that makes a Marimekko hard to read.

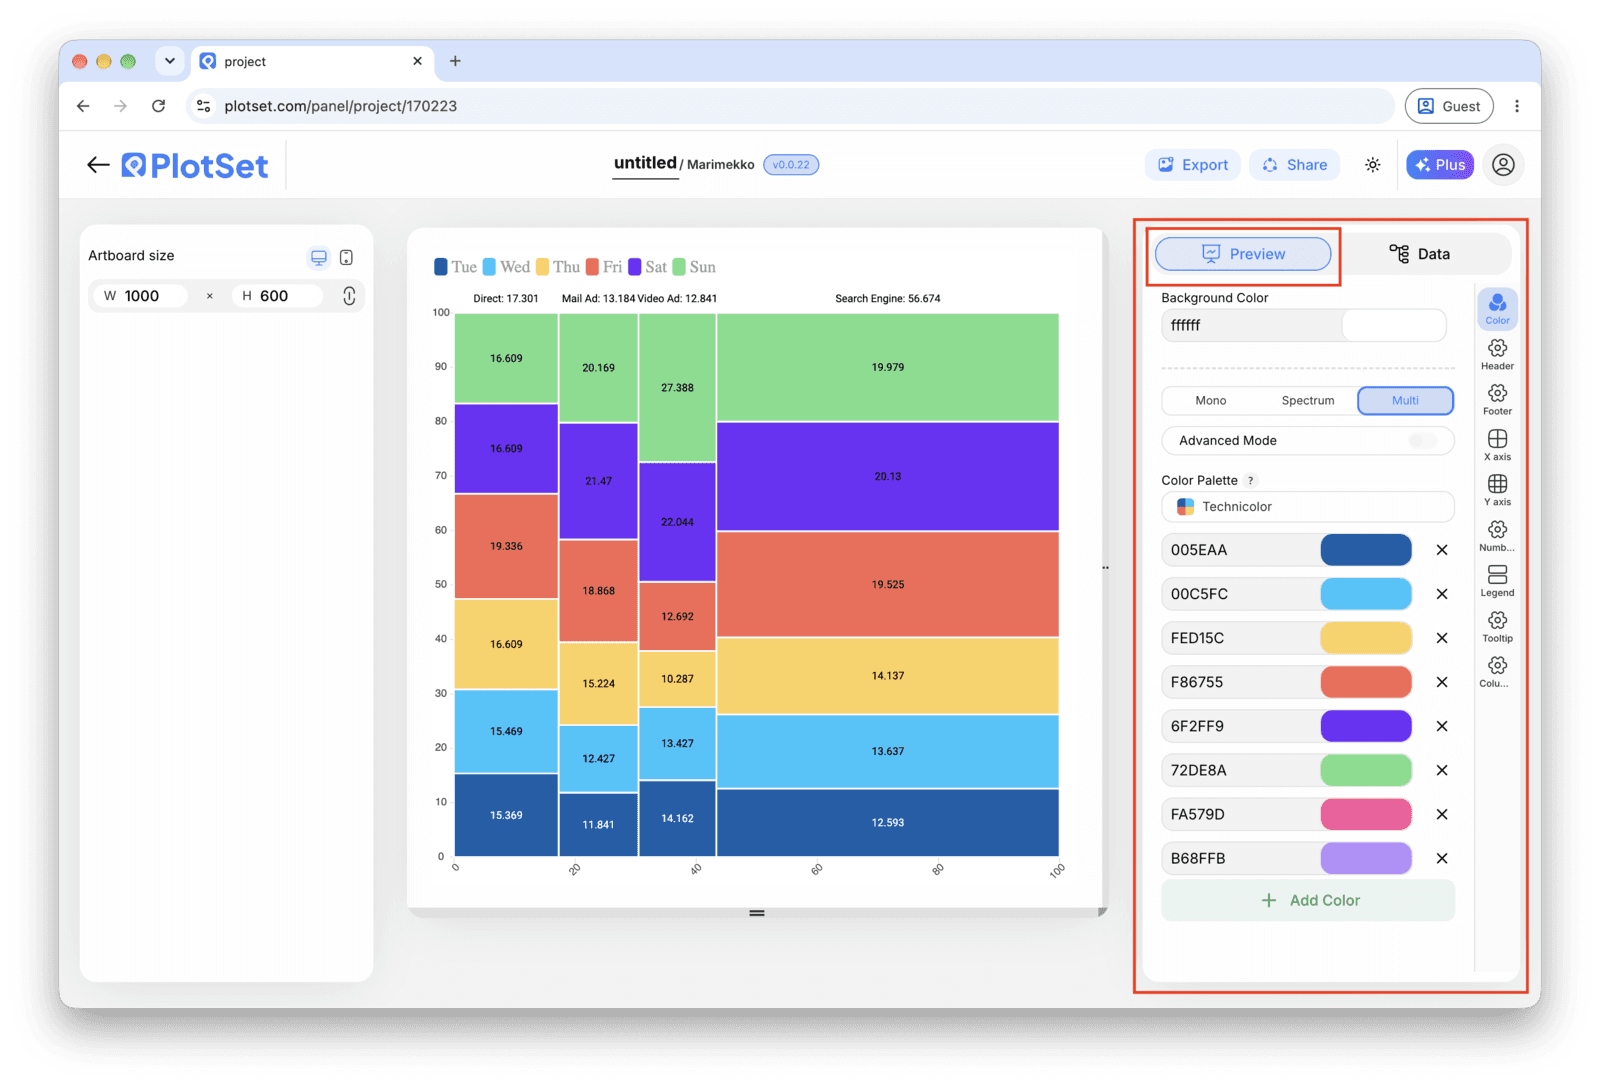
Marimekko Chart 的「Preview」标签页。所有样式设置都在红框标出的这个面板里,每个设置各自占一个标签页:外观、标题、脚注,以及这种图表类型特有的选项。 - 08
Pick colors and publish, embed or export
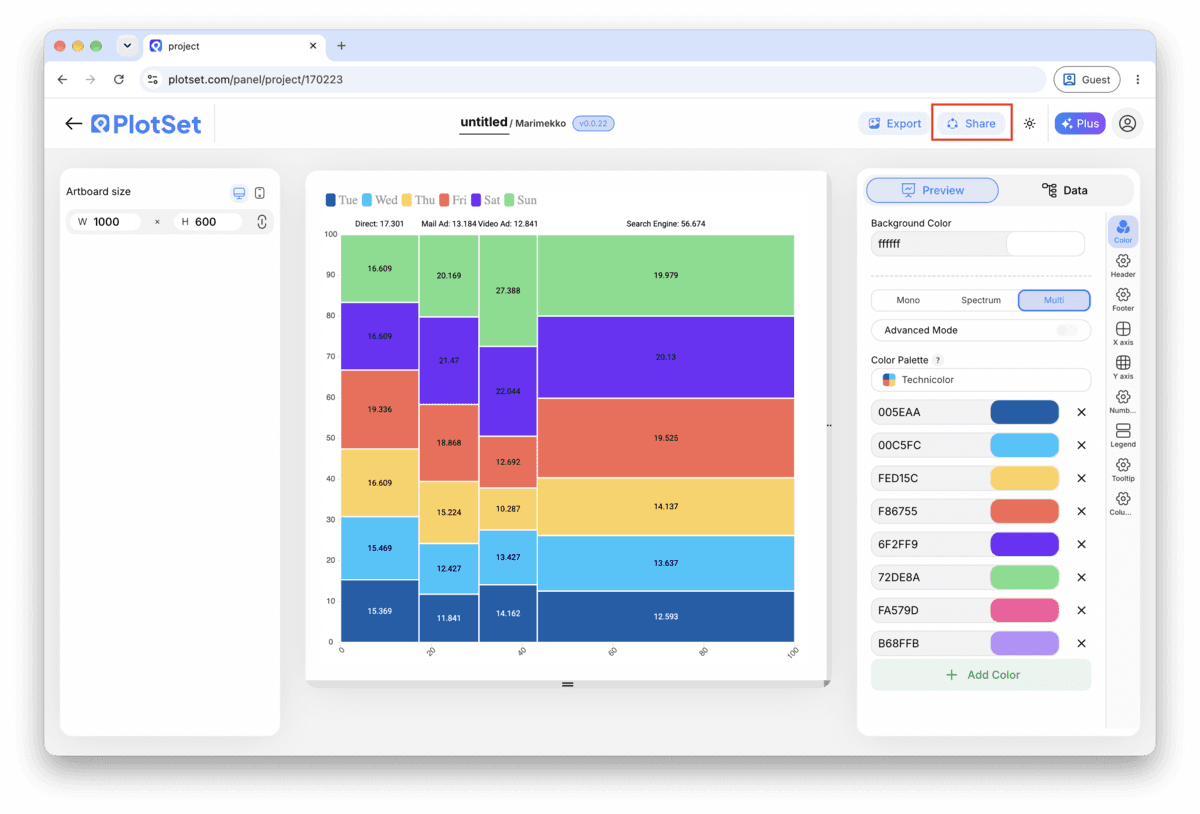
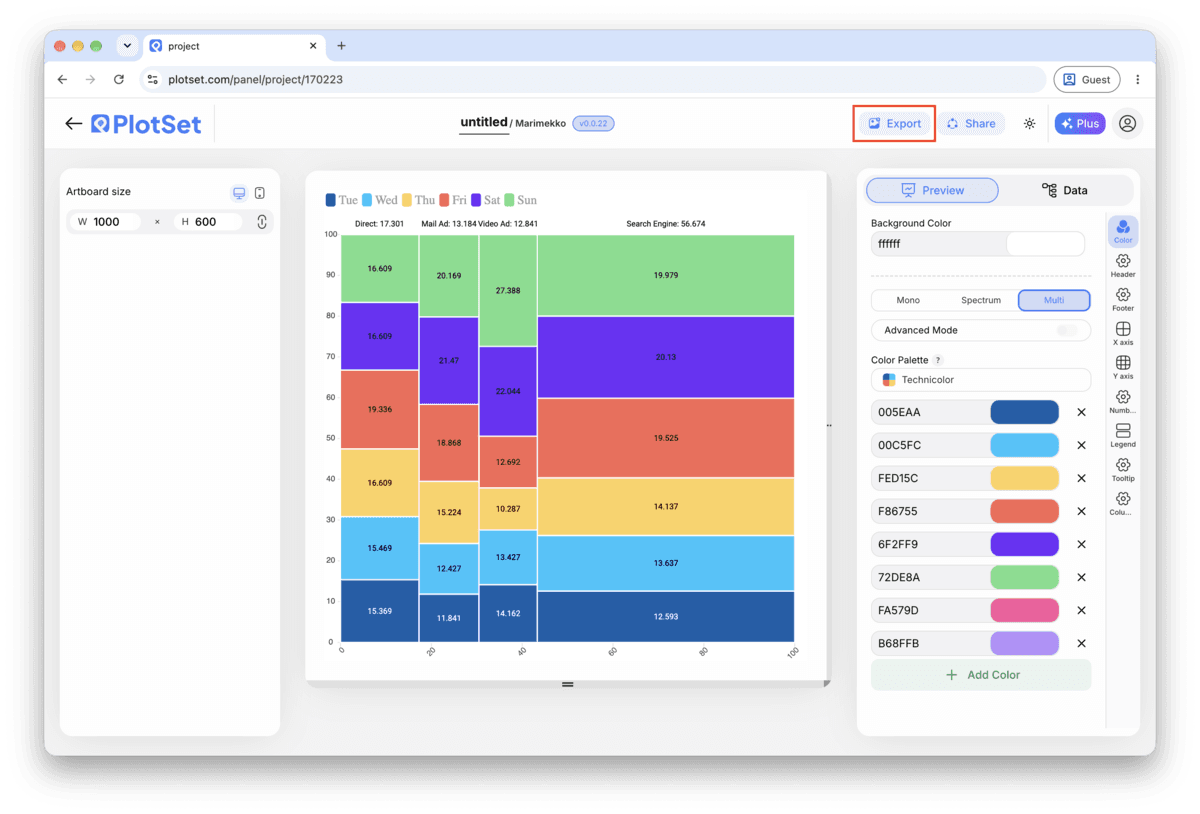
Assign one color per subdivision and keep that mapping constant across every column, the same way you kept the stacking order constant. Then publish for a live interactive chart with hover tooltips, grab the embed code for a page, or export a PNG, SVG or PDF for a deck.
从已加载示例数据的 Marimekko Chart 模板开始,再替换成你自己的数据。
打开模板Marimekko Chart 的样式提示
Label the top axis, not just the blocks
The width of each column is half of what a Marimekko encodes, and it is the half readers miss most often. A cumulative scale along the top turns an implied comparison into one they can actually read.
Lock the subdivision order before you touch color
Set the stacking order once, confirm it holds across every column, and only then start assigning colors. Reordering after coloring means redoing the color mapping too.
Group anything under about five percent into Other
A subdivision too small to get its own labeled sliver just clutters the chart. Fold it into a named Other block per column rather than leaving a row of unreadable slivers.
Keep it to a handful of segments and stacks
Six columns and five stacks is already a lot to compare by area. Past that, filter to the segments that matter (top regions, top categories) and say so in the title or a caption.
制作 Marimekko Chart 时的常见错误
Every column comes out the same width
This usually means the value column uploaded as text rather than a number, or two rows spelled the segment name differently ("APAC" versus "Asia Pacific") so PlotSet cannot sum them into one segment total. Fix the spelling or the number format in the source sheet and re-upload.
The stacking order flips between columns
Each column is sorting its subdivisions independently, usually by value, instead of using one fixed order. Set the subdivision order explicitly in the chart settings rather than leaving it on automatic, and it will hold across every column.
Blocks are too thin to label
Too many segments, too many subdivisions, or both. Filter the segments to the ones carrying the story and fold small subdivisions into an Other block before uploading again.
深入了解 Marimekko Chart
不确定 Marimekko Chart 是否是正确选择?查看它是什么、何时使用以及何时不使用。
Marimekko Chart:常见问题
Three: a segment (the column), a subdivision (the stack inside it), and a value. One row per segment-subdivision pair, in long format. PlotSet calculates each column's width from the segment totals, so you never enter a width directly.
现在制作你的 Marimekko Chart
免费开始,300+ 模板任选。无需信用卡。