PlotSet LogoPlotSet

How to Create an Online Calculator

A step by step walkthrough for turning a spreadsheet of questions into a published, embeddable calculator in PlotSet, with a formula that computes a result from visitors' answers.

约 10 分钟

A short sequence of questions followed by a computed result, such as a score, an estimate or a recommendation, ready to embed on your page: that is what you will have. Each row of a spreadsheet becomes one question, and a formula you write turns the answers into a number.

Expect about ten minutes. Most of it is deciding the questions and the formula, since the template does the rest. Test it with a few known inputs before you publish.

你需要的数据

One row per question with a question text and type, then optional answer options, a default answer, help text, an image URL and extra numeric columns such as a weight.

示例 CSV
question_textquestion_typeanswers_rawfallback_valuecontext_textimageweight_co2
How many miles do you drive per week?number50Include commuting and errands0.4
How often do you fly each year?slider"0101"2Return trips count as two250
What is your diet?dropdownVegan|Vegetarian|Mixed|Meat heavyMixed1
How many people live in your home?rating52
备注

Question type must be one of text, number, dropdown, date, rating, slider or buttons. Anything else becomes a text box.

For dropdown and buttons, separate options with a pipe. Use label=value to store a value different from the label.

For rating, give the number of icons. For slider, give min,max,step, such as 0,10,1.

Extra numeric columns, such as a weight, are available in the formula as q1_weight, named by question number and column header.

操作步骤

PlotSet 中从空白模板到完成图表的具体点击路径。

  1. 01

    Open the Calculator template

    From the PlotSet dashboard, start a new project and choose Calculator from the Other category. It loads with an eight-question sample so you can see every question type working.

    PlotSet 的模板选择界面:左侧是图表分类列表,中间展开 Bar Charts 分类的模板网格,Bar Chart 模板卡片上显示「Select」按钮。
    每份指南都从这里开始:先选分类,再选模板,不管你要做哪种图表,用的都是同一个网格。
  2. 02

    Write your questions

    Give each question a prompt and a type, then add options, a sensible default and a line of help text where it helps. Keep each question short and answerable in one move.

  3. 03

    Upload the file, or connect it live

    Import a CSV or .xlsx file from the data panel, paste rows from a spreadsheet, or connect a Google Sheet so changes to the questions flow through. The first row is read as the headers.

    PlotSet 编辑器的数据视图:表格中 Name、Value、Region 三列填着加拿大各省的数据,旁边的「Data」面板提供 CSV 上传、「Magic Import」和 Google Sheet 同步。
    这里的数据视图取自一个条形图项目。你可以上传 CSV、用「Magic Import」从图片里提取数字,或同步 Google Sheet,每种图表类型的面板都一样。
  4. 04

    Check the column bindings

    Confirm which column is the question text, type, options, default, help text, image and extra data. This is usually right automatically when the headers are clear.

    PlotSet 数据面板中高亮的列绑定:「Label/time」对应 A 列,「Values」对应 B 列,「Filter/color」对应 C 列,下方是「Auto Binding」按钮。
    绑定决定哪一列作标签、哪一列提供数值、哪一列决定颜色。「Auto Binding」(自动绑定)会根据表头推测,所以要核对一遍,别想当然。
  5. 05

    Write the result formula

    Open the Submit and result tab. In the variables box add one name equals expression line per value, referring to answers as q1, q2 and so on. Then write the result text and put the names in double curly brackets.

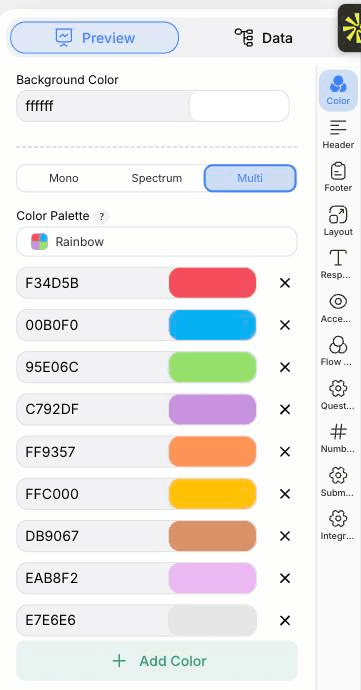
    PlotSet 编辑器停在「Preview」标签页:画布上是做好的 Calculator,右侧的设置面板用红框标出。
    Calculator 的「Preview」标签页。所有样式设置都在红框标出的这个面板里,每个设置各自占一个标签页:外观、标题、脚注,以及这种图表类型特有的选项。
  6. 06

    Choose the flow

    In the Flow and design tab, show one question at a time with Back and Next buttons, or all questions on one page. Style the card, buttons and inputs to match your site.

  7. 07

    Style the question types

    The Question types tab styles each control separately: text and number inputs, dropdowns, rating icons, sliders and button groups.

  8. 08

    Test it, then publish

    Answer every question with known values and check the result against a hand calculation. Then publish and copy the embed code from the Share dialog.

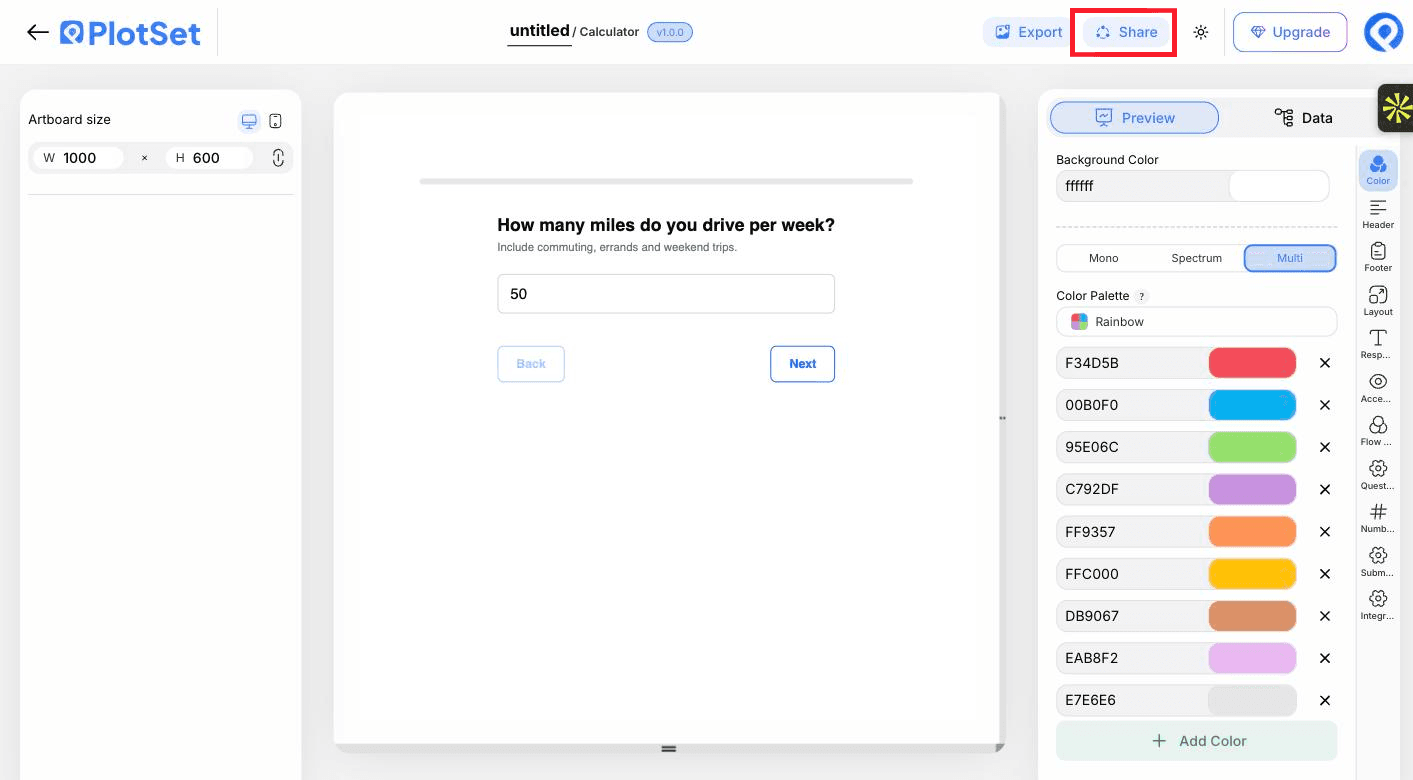
    PlotSet 编辑器工具栏中高亮的「Share」按钮,紧挨着「Export」按钮。
    点「Share」,完成的图表就会变成一个公开链接和一段嵌入代码。

从已加载示例数据的 Calculator 模板开始,再替换成你自己的数据。

打开模板

发布、嵌入或导出

最后一段路对每种图表都一样:「Share」(分享)把图表变成一个在线的公开链接和一段嵌入代码,「Export」(导出)把它输出成静态文件。

Share:公开链接与嵌入代码

打开嵌入代码和公开链接的开关,图表就发布出去了。链接可以放心发给任何人;嵌入代码以 iframe 的形式放进任意页面,悬停提示和交互效果都会保留。之后修改了图表,点「Recreate」就能把改动同步到链接和嵌入代码两边。

PlotSet 编辑器工具栏中高亮的「Share」按钮,紧挨着「Export」按钮。
点「Share」,完成的图表就会变成一个公开链接和一段嵌入代码。
PlotSet 的「Share」对话框:用于启用嵌入代码和公开链接的开关,「Link」「Embed」「Facebook」「Reddit」「Twitter」「LinkedIn」「Email」几个按钮,以及带「Copy」按钮的图表公开链接。
打开嵌入代码和公开链接的开关,然后复制链接或取用 iframe。之后再修改图表,点「Recreate」就能把改动同步给所有已拿到链接的人。

Export:SVG、PNG 或 JPG

「Export」会按你需要的尺寸输出一份静态副本。SVG 放到多大都清晰,还能在设计工具里继续编辑;幻灯片和文档用 PNG 或 JPG 最稳妥。想让图片在高分屏上够锐利,关键就是那个倍数设置。

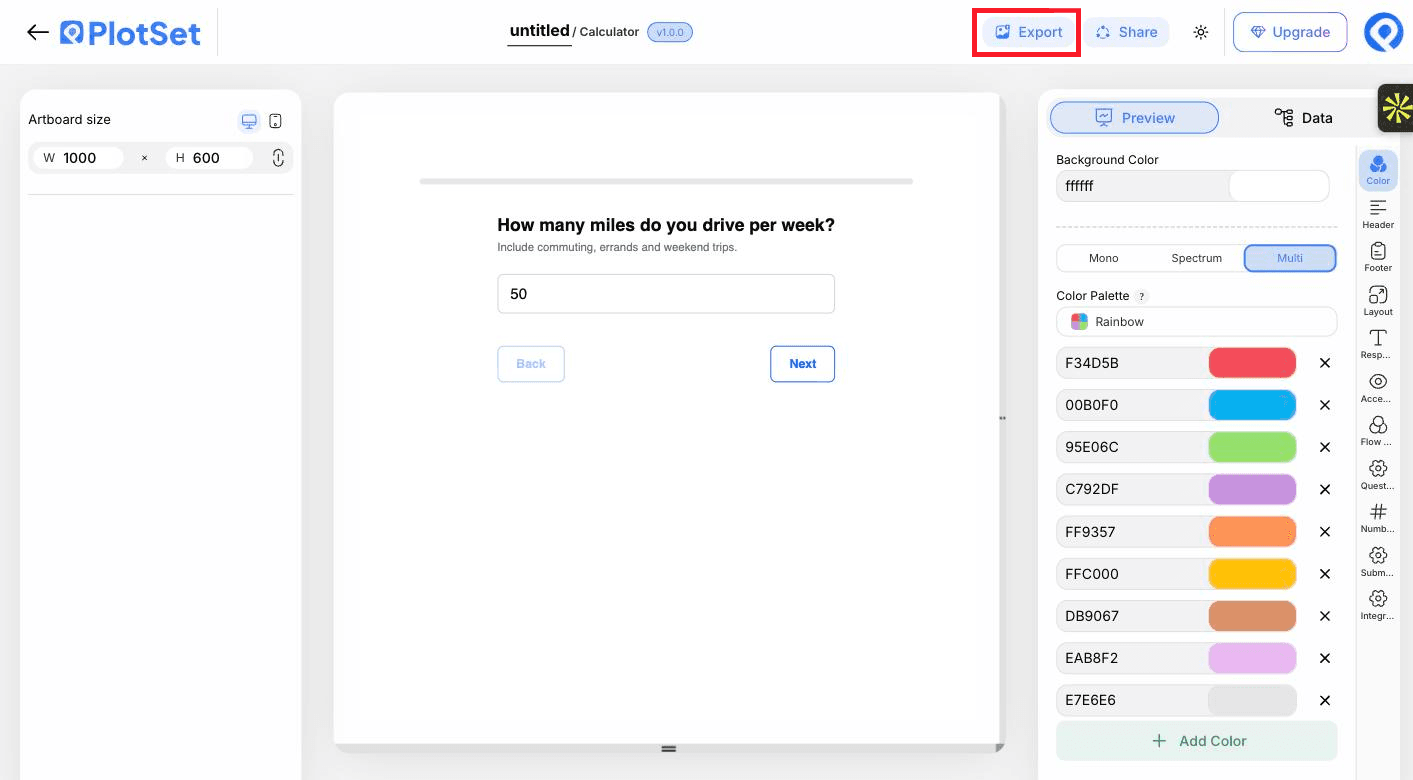
PlotSet 编辑器工具栏中高亮的「Export」按钮。
要做成幻灯片或报告里的静态文件,就走「Export」这条路。
PlotSet 的「Export chart」对话框:倍数选择器设为 2x,宽高输入框填的是 1000 和 600,展开的格式菜单里列出 SVG、PNG 和 JPG。
SVG 放到多大都清晰,还能在设计工具里继续编辑;做幻灯片用 PNG 或 JPG 最稳妥。导出前先设好倍数,图片在高分屏上才够锐利。

Calculator 的样式提示

Test with round numbers

Use inputs whose answer you can work out in your head, so a wrong formula is obvious.

Give honest defaults

An untouched question uses its default, so pick the most common answer rather than zero.

Name your variables

Build the result in named steps, such as driving, flights and total, so the formula stays readable.

Format the result

Use the Number and date format tab to set prefixes, suffixes and decimals so the result reads as a cost, a percentage or a weight.

制作 Calculator 时的常见错误

The result shows zero

A line in the formula is probably malformed, and a bad line silently evaluates to zero. Check the spelling of each name and bracket.

A question appears as a text box

The type was misspelled or missing, so it fell back to text. Check it matches one of the seven types exactly.

The numbers shifted after reordering

Formulas use q1, q2 and so on by sheet order. If you move rows, update the formula.

The exported image does not match the live chart

The static export redraws the current state approximately. Use the live embed for the real experience.

深入了解 Calculator

不确定 Calculator 是否是正确选择?查看它是什么、何时使用以及何时不使用。

关于 Calculator

Calculator:常见问题

A question text and a question type for each row. Options, defaults, help text, an image and extra numeric columns are optional.

现在制作你的 Calculator

免费开始,300+ 模板任选。无需信用卡。