MapsGrátis
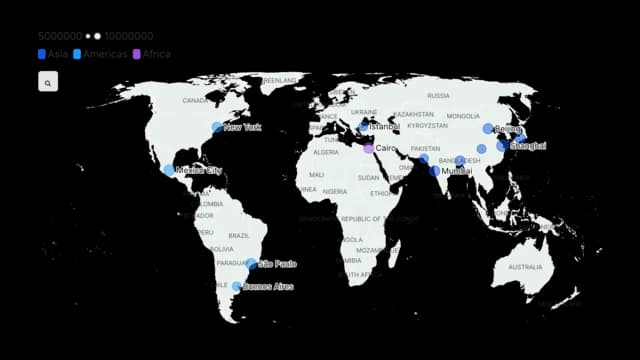
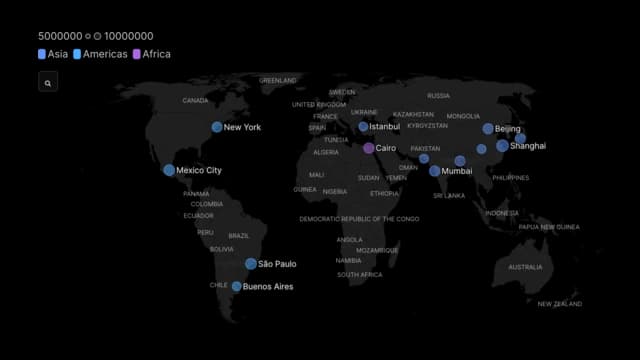
Projection map
Crie um gráfico Projection map no PlotSet: comece com este modelo, troque os dados pelos seus e depois incorpore ou exporte como PNG, SVG ou PDF.
(Sem Necessidade de Cartao de Credito)
Comece com um exemplo
Escolha um para abrir sua própria cópia editável.
 As Climate Changes, Southern States Will Suffer More Than Others
 Air-source heat pumps are better at heating in warmer areas
 Consumo de alcohol por países no mundo
 London
 As Climate Changes, Southern States Will Suffer More Than Others
 Spring Temperature Change
 Illinois had the 9th highest fertility treatment rate in 2023
 SUN BELT MIGRATION SLOWING
 Le nombre de migrants disparus entre 2014 et 2024
 Rooftop solar can cover 45% of electricity consumption in Türkiye
 Solar power potential in Türkiye
 The Most Popular MLB Teams by County
Mais modelos de Maps
New York (boroughs) Choropleth
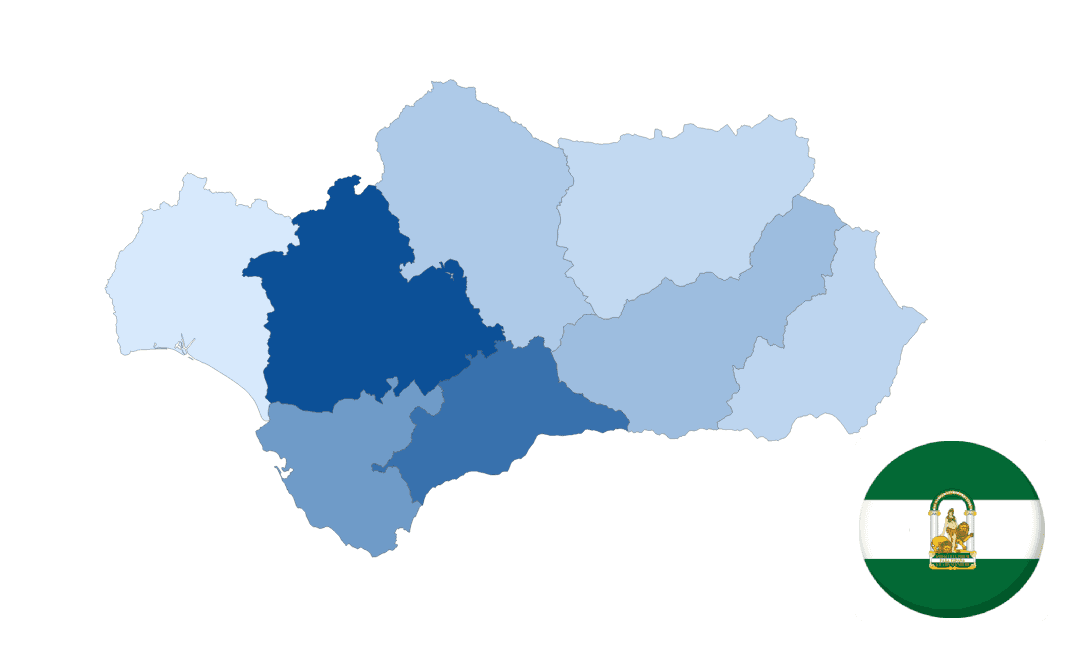
Andalusia (provinces) Choropleth
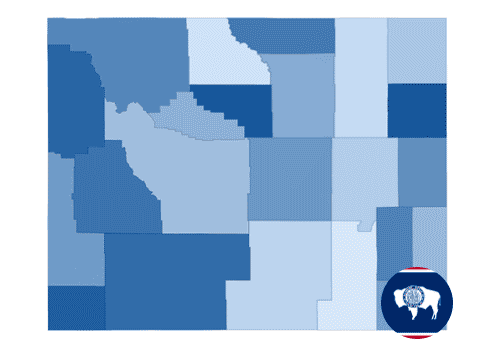
Wyoming (counties) Choropleth
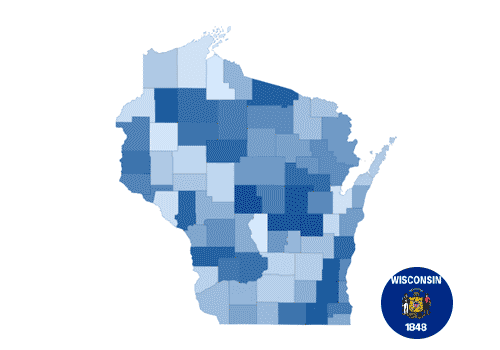
Wisconsin (counties) Choropleth
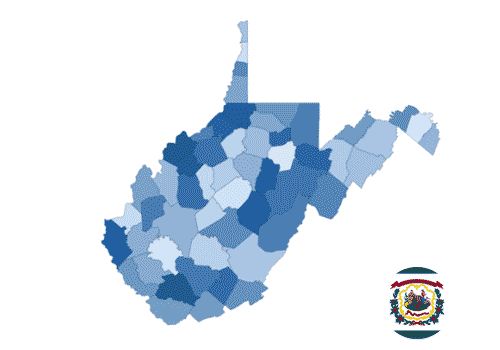
West Virginia (counties) Choropleth
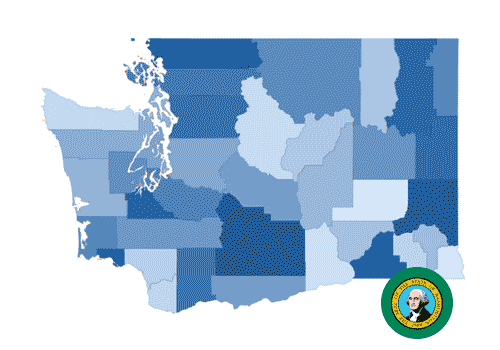
Washington (counties) Choropleth
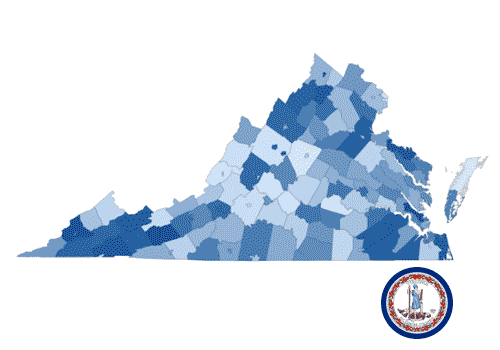
Virginia (counties) Choropleth
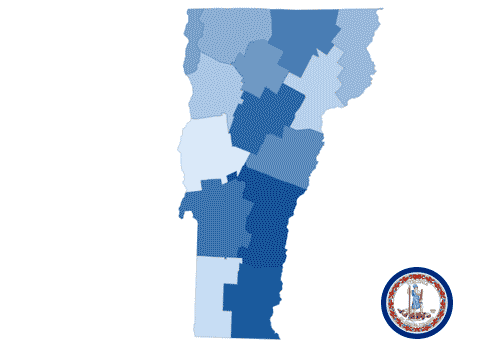
Vermont (counties) Choropleth
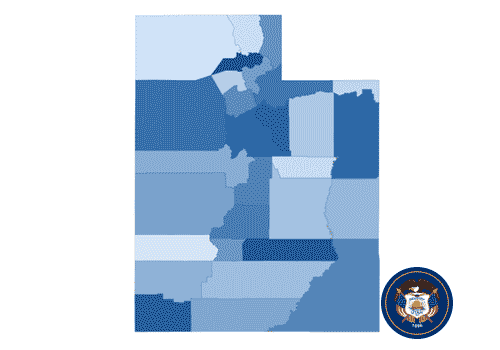
Utah (counties) Choropleth