PlotSet LogoPlotSet

How to Create a Timeline

A step by step walkthrough for turning a list of dated events into a published timeline in PlotSet, from shaping the sheet to exporting or embedding the finished chart.

Cerca de 7 minutos

This walkthrough covers how to create a timeline in PlotSet out of a sequence of dated events, each carrying a title and just enough context that a reader gets the story without pinging you for the slide deck behind it. Your own milestones go through the same click path a published PlotSet chart takes, from upload to publish, not a demo running on placeholder dates.

Seven minutes is enough once your events already have clean dates and short titles. Still deciding what precision to date things at, or pulling dates out of a spreadsheet that stored them as text, adds another five. Treat the seven minutes below as the target and the rest as buffer.

Os dados que você precisa

Four columns, one row per event: a date, a short title, an optional note, an optional image URL. Only the date and title are required, and one header row.

CSV de exemplo
DateTitleNoteImage
1961-05-25Kennedy commits to the MoonKennedy tells Congress the US will land a man on the Moon before the decade is out
1966-02-03Luna 9 soft-landsFirst spacecraft to land softly on the Moon
1967-01-27Apollo 1 fireCabin fire during a launch rehearsal kills the three man crew
1968-12-21Apollo 8 launchesFirst crewed mission to leave low Earth orbit and circle the Moon
1969-07-20Apollo 11 landsArmstrong and Aldrin land in the Sea of Tranquilityhttps://example.com/images/apollo-11.jpg
1970-04-11Apollo 13 launchesOxygen tank explosion forces the crew to abort the Moon landing
1972-12-14Apollo 17 endsLast crewed Moon landing mission. Cernan is the last to walk on the Moon
Anotações

Keep date precision consistent across every row: all years, or all full dates. PlotSet renders whatever precision you give it, so a chart mixing "1969" with "1969-07-20" reads as sloppy rather than intentional.

Rows do not need to already be in date order before you upload. PlotSet sorts events chronologically once the date column is mapped, so paste them in whatever order your source document used.

The note column is for a sentence or two. Anything longer gets clipped inside the marker card, so put the extra detail in a linked document and use the note for the one line that actually matters.

Image URLs need to be public and stay live. A link into a personal drive folder or a private channel shows a broken image icon on the published chart instead of the picture.

Os passos

O caminho exato no PlotSet, de um modelo em branco até o gráfico finalizado.

  1. 01

    Open the Timeline template

    From the PlotSet dashboard, start a new project and choose the Timeline template. It loads with a handful of sample events already bound to a date, a title, a note and an image, so you can see the exact column shape before you touch your own file.

    O seletor de modelos do PlotSet: as categorias de gráficos listadas à esquerda, a grade Bar Charts aberta e o card do modelo Bar Chart mostrando o botão Select.
    Todo guia começa aqui. Escolha a categoria e depois o modelo: a grade é a mesma, seja qual for o tipo de gráfico que você quer.
  2. 02

    Shape your sheet into four columns

    Date first, then a short title, then an optional note, then an optional image URL, one row per event. Only the date and title columns are required. If your source is a project doc or a wiki page, pull just those four things out rather than dragging in every field you have.

  3. 03

    Get your events into PlotSet

    Import a CSV or .xlsx file from the data panel, paste rows straight from a spreadsheet, or connect a Google Sheet if you expect to add events later without a re-upload. PlotSet reads the first row as headers automatically.

    A visualização de dados do editor do PlotSet: uma planilha com as colunas Name, Value e Region preenchidas com números de províncias canadenses, ao lado do painel Data, que oferece envio de CSV, Magic Import e sincronização com o Google Sheet.
    A visualização de dados, aqui em um projeto de gráfico de barras. Envie um CSV, extraia os números de uma imagem com o Magic Import ou sincronize um Google Sheet. O painel é idêntico para todos os tipos de gráfico.
  4. 04

    Map the date, title, note and image columns

    Confirm which column feeds each part of the marker. This is usually automatic when your headers are named clearly, but check it manually if your sheet carries extra columns PlotSet might have guessed wrong on.

    O painel Data do PlotSet com os vínculos de colunas em destaque: Label/time apontando para a coluna A, Values para a coluna B e Filter/color para a coluna C, com o botão Auto Binding logo abaixo.
    Os vínculos definem qual coluna vira o rótulo, qual fornece os valores e qual comanda a cor. O Auto Binding tenta adivinhá-los a partir dos seus cabeçalhos, então confira o resultado em vez de dar como certo.
  5. 05

    Check the order and trim to the events that matter

    PlotSet sorts events chronologically once they are mapped, so scan the result for anything that landed in the wrong place, usually a date typed in an inconsistent format. This is also the point to cut anything that does not change the story. Five to twenty events is the range that stays readable.

  6. 06

    Style the spine and markers

    Set the spine to horizontal or vertical depending on where the chart will live, then size the markers: larger for the two or three events that carry the story, default size for the rest. Leave the alternating left-right layout off unless the events are dense enough that labels start to overlap.

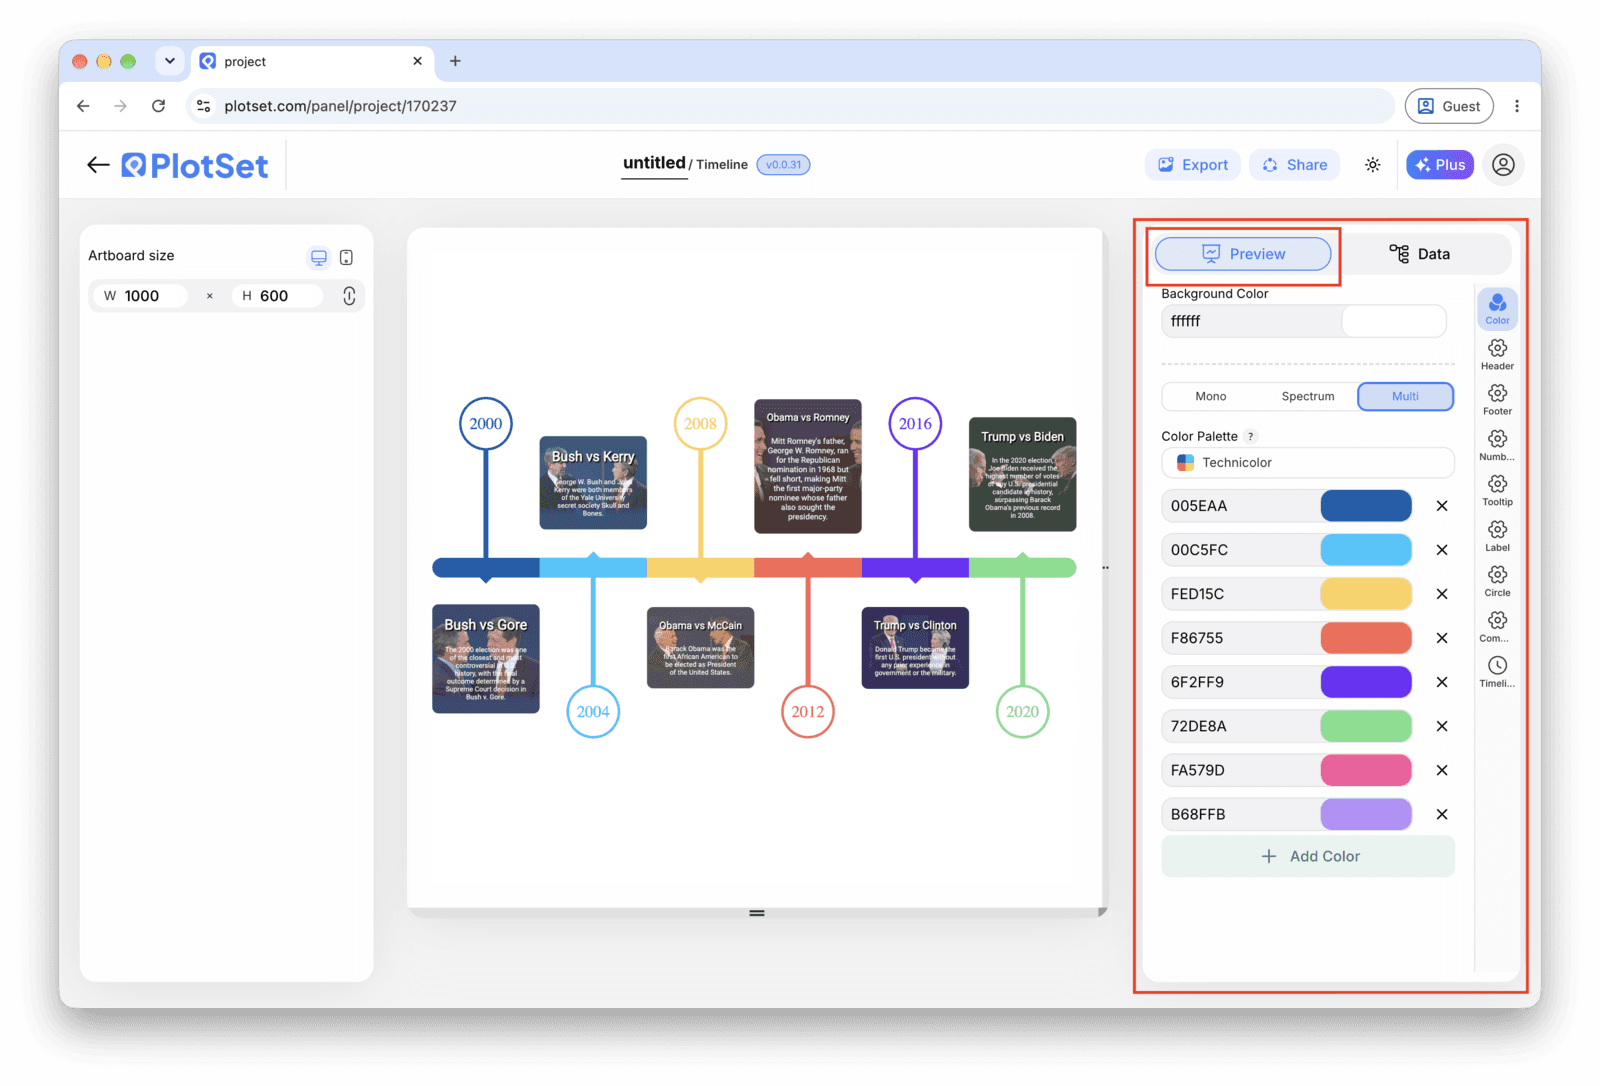
    O editor do PlotSet na aba Preview: um gráfico do tipo Timeline já finalizado na área de edição e, na lateral direita, o painel de configurações contornado em vermelho.
    A aba Preview de um gráfico do tipo Timeline. Todos os controles de estilo ficam no painel contornado em vermelho: aparência, cabeçalho, rodapé e as opções específicas desse tipo de gráfico. Cada grupo fica em sua própria aba.
  7. 07

    Write the titles like headlines

    Lead each title with what changed, not the date, since the date is already on the axis right next to it. Save the note for the sentence a reader would want if they stopped to read, and leave it blank on rows where there is nothing worth adding.

  8. 08

    Publish, embed or export the timeline

    Publish for a live, interactive timeline where each marker opens its note and image on click, grab the embed code to drop it into a page, or export a PNG, SVG or PDF if you need a static version for a deck or a report.

Comece pelo modelo de Timeline com dados de exemplo já carregados, depois substitua-os pelos seus.

Abrir o modelo

Publique, incorpore ou exporte

A reta final é igual para todo tipo de gráfico: o Share transforma o gráfico em um link público interativo e em um código de incorporação; o Export gera um arquivo estático.

Share: link público e código de incorporação

Ativar o código de incorporação e o link público é o que publica o gráfico. O link pode ser enviado com segurança para qualquer pessoa, e o código de incorporação entra em qualquer página como um iframe que mantém a interatividade e os tooltips ao passar o mouse. Edite o gráfico depois e clique em Recreate para levar essas mudanças aos dois.

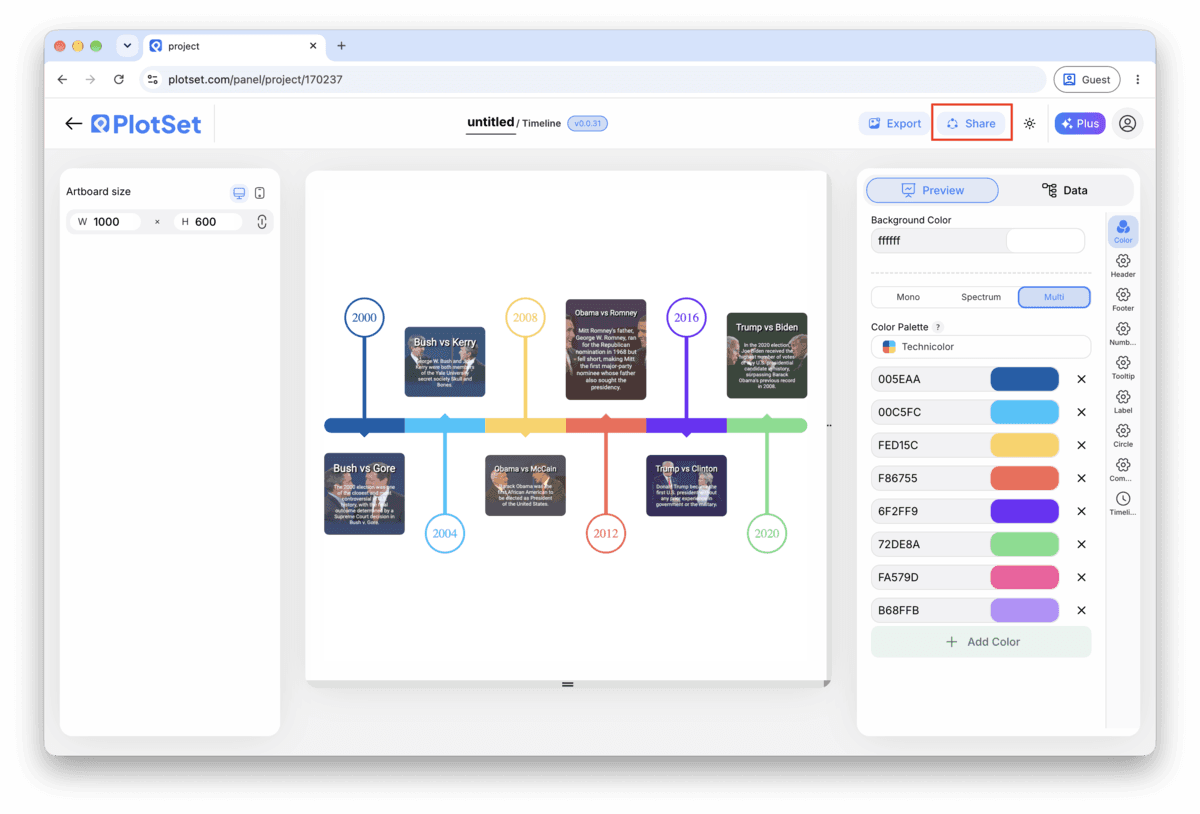
A barra de ferramentas do editor do PlotSet com o botão Share em destaque, ao lado do botão Export.
É pelo Share que um gráfico finalizado vira um link público e um código de incorporação.
A janela Share do PlotSet: a chave que ativa o código de incorporação e o link público, os botões Link, Embed, Facebook, Reddit, Twitter, LinkedIn e Email, e o link público do gráfico com um botão Copy.
Ative o código de incorporação e o link público, depois copie o link ou pegue o iframe. O Recreate leva as edições seguintes a todo mundo que já tem o link.

Export: SVG, PNG ou JPG

O Export grava uma cópia estática no tamanho que você precisar. O SVG continua nítido em qualquer escala e ainda pode ser editado em uma ferramenta de design; PNG e JPG são as escolhas seguras para slides e documentos. É o multiplicador de escala que garante uma imagem nítida em uma tela retina.

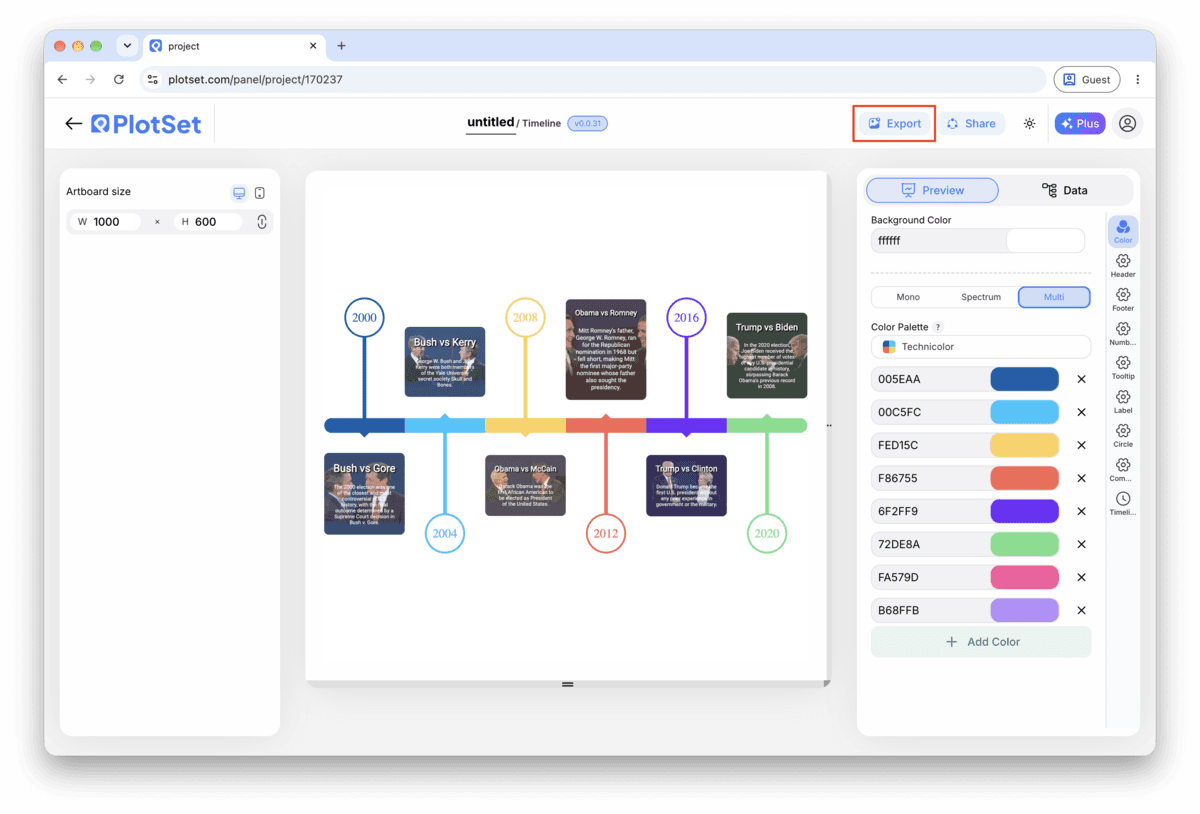
A barra de ferramentas do editor do PlotSet com o botão Export em destaque.
O Export é o caminho para gerar um arquivo estático para um slide ou um relatório.
A janela Export chart do PlotSet: um seletor de escala em 2x, campos de largura e altura definidos como 1000 por 600 e o menu de formatos aberto com SVG, PNG e JPG.
O SVG continua nítido em qualquer tamanho e editável em uma ferramenta de design; PNG e JPG são as escolhas seguras para uma apresentação. Defina a escala antes de exportar para que a imagem fique nítida em uma tela retina.

Dicas de estilo para um Timeline

Keep the layout single sided under ten events

The alternating left-right layout earns its place once markers start crowding a single line, but for a short timeline it just adds movement the reader has to track. Turn it on only once labels are genuinely colliding.

Size markers by importance, not decoration

Set a larger marker for the two or three events that actually carry the story and leave the rest at the default size. A reader picks up the hierarchy before they have read a single title.

Save images for the moment they add information

An image on every marker inflates every card to the same height and turns a quick scan into a scroll. Attach one where a photo genuinely tells the reader something the title cannot (a product shot, a diagram, a screenshot) and leave the rest blank.

Match the date format to your actual precision

If your rows are years, set the chart's date format to show years only instead of defaulting to a full date. A timeline that displays a fabricated month and day for an event you only know happened sometime in 1969 is claiming a precision you do not have.

Erros comuns ao fazer um Timeline

Two events land on top of each other

This usually means two rows share the same date, or dates close enough together that the markers overlap and the labels collide. Check the data table for duplicate or near-duplicate dates and either merge them into one event or correct the date if the sources actually disagree.

An event goes missing from the chart

A blank cell in the date column gets skipped rather than flagged, so the row disappears with no error. Scroll through PlotSet's data table and check that every row has a date before assuming your sheet uploaded in full.

A title gets cut off mid word

This means the title is running longer than the marker card has room for, not that anything broke. Shorten it to something closer to a headline and move the rest of the sentence into the note field, which has more room to work with.

Saiba mais sobre o Timeline

Não tem certeza se o Timeline é a escolha certa? Veja o que é, quando usar e quando evitar.

Sobre o Timeline

Timeline: perguntas frequentes

Four columns with one header row: a date, a short title, and two optional columns, a note and an image URL. Only the date and title are required. CSV and .xlsx both work, and a pasted range from any spreadsheet tool is fine too, as long as the date column parses as an actual date rather than text.

Crie seu Timeline agora

Grátis para começar com mais de 300 modelos. Sem cartão de crédito.