
Nvidia hit $5 trillion in market value today.
It's the first company in history to do that. In fact, it added about $300 billion in a day. What happened? Let dig a little.
6 min de leitura
It's the first company in history to do that. In fact, it added about $300 billion in a day. What happened? Let dig a little.
6 min de leitura
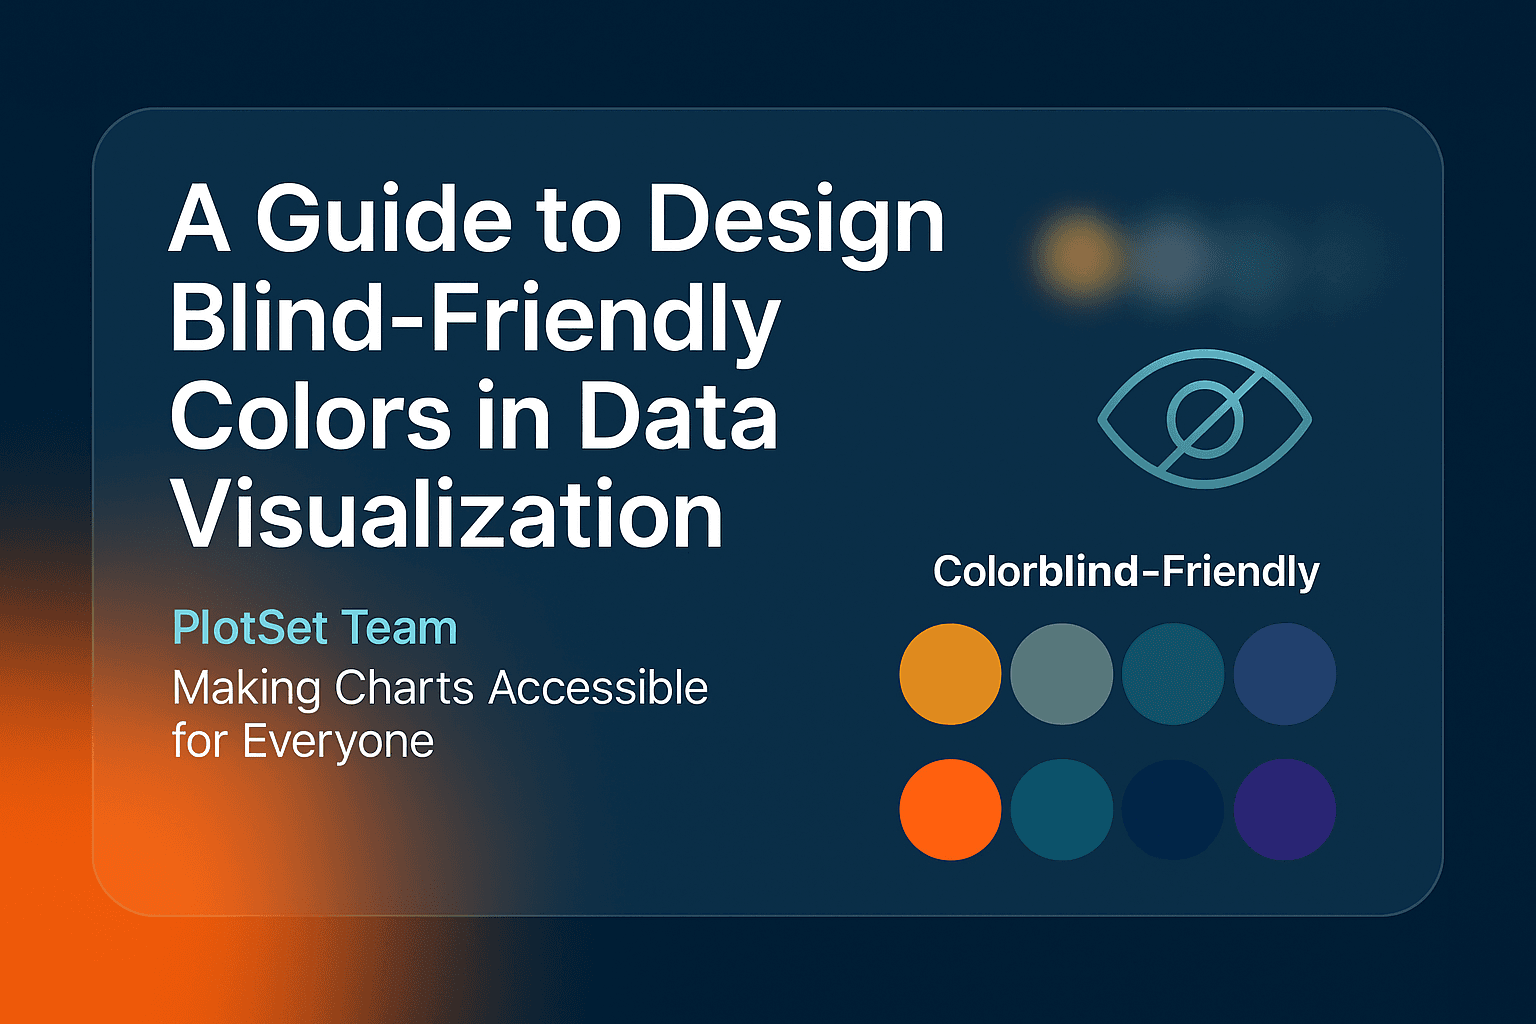
How to pick a colorblind-friendly palette for charts: which colors clash, the Okabe-Ito palette, contrast targets, shapes and labels, and how to test.
7 min de leitura

Ten ChatGPT prompts for data visualization, from choosing a chart to cleaning data and writing captions, plus what to check before you trust the answer.
6 min de leitura
Create a stacked area chart step by step, using 60 years of world energy data from the Energy Institute. When to use one, how to set it up, and what to avoid.
6 min de leitura
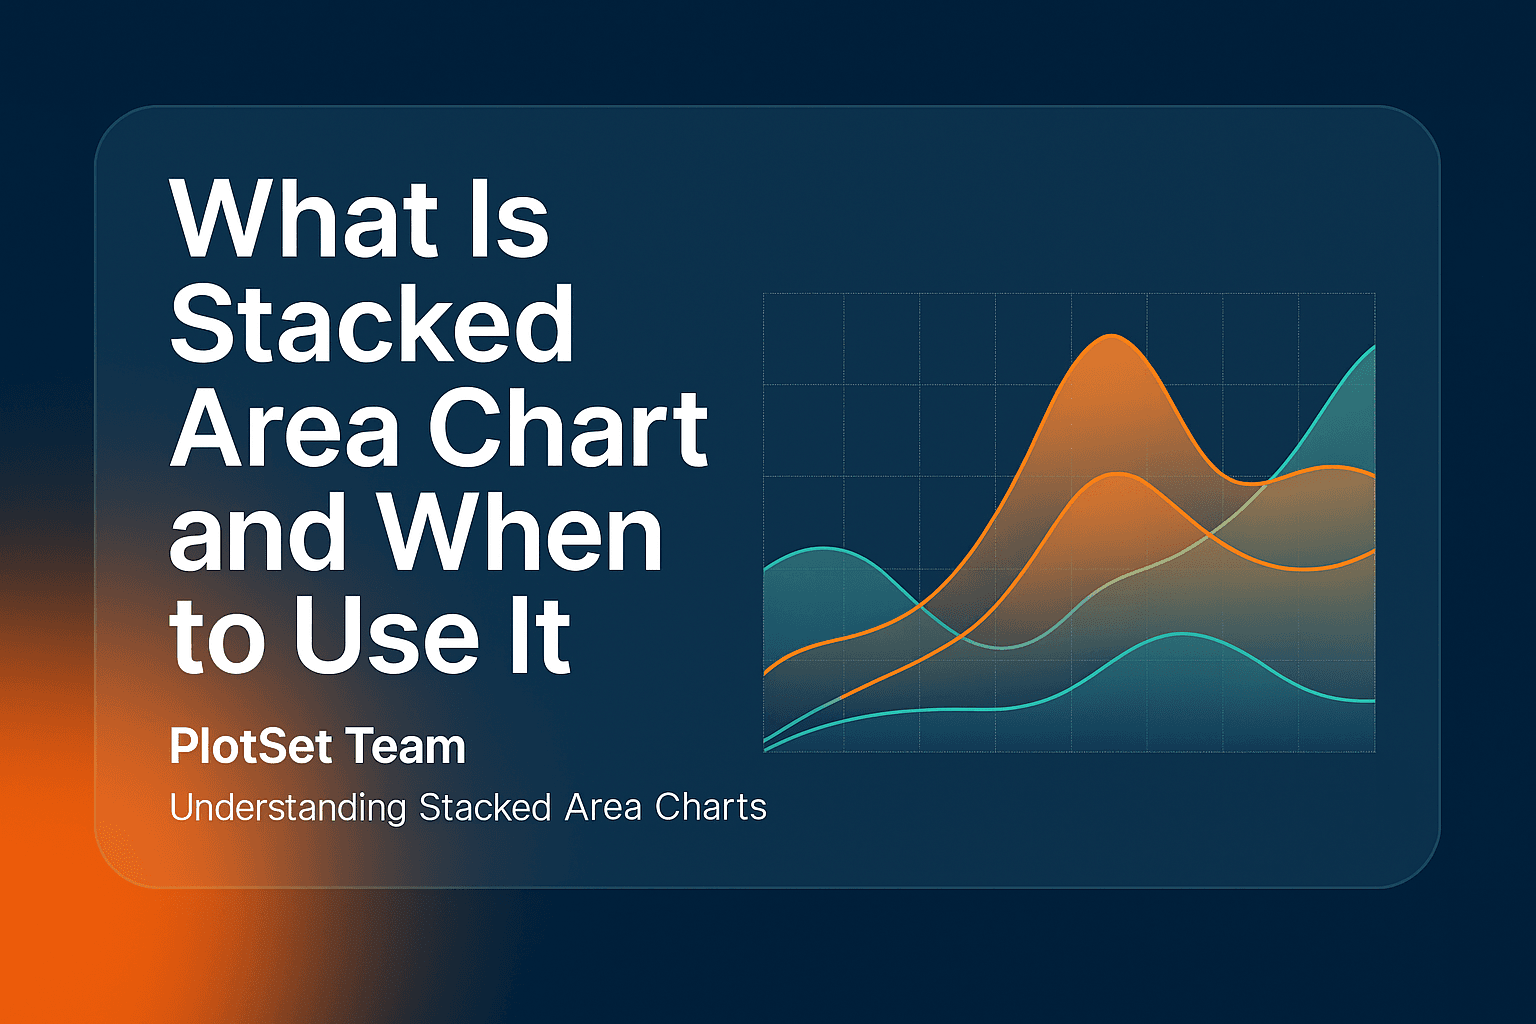
A stacked area chart shows a total over time and what it is made of. Learn when to use one, what data it needs, and when a line or stream graph is better.
6 min de leitura
How to create a bar chart that reads at a glance: when to use bars or columns, the types to know, the rules that matter, and two live examples.
7 min de leitura
Which chart shows revenue best? Line for trends, bars for comparisons, stacked columns for segments. Live example built from five companies' SEC filings.
6 min de leitura
Discover the process of crafting a Connected Dots visualization showcasing the revenue outlook of leading US companies. Enhance your data visualization skills today.
5 min de leitura
Learn how to create a population pyramid from age and sex data: the table layout, the settings that matter, and a live example of Italy in 2025.
6 min de leitura
Make a force-directed circle packing chart step by step, using World Bank data on R&D spending in 28 countries. Free, interactive and embeddable.
5 min de leitura
How to create a spiral bubble chart step by step, using the Paris 2024 gold medal table. When a spiral works, which settings matter, and what to avoid.
5 min de leitura
Create a circle packing chart step by step, using NASA's sunlight-intensity data for the eight planets. Free, interactive, and embeddable.
5 min de leitura