What is a circle packing chart?
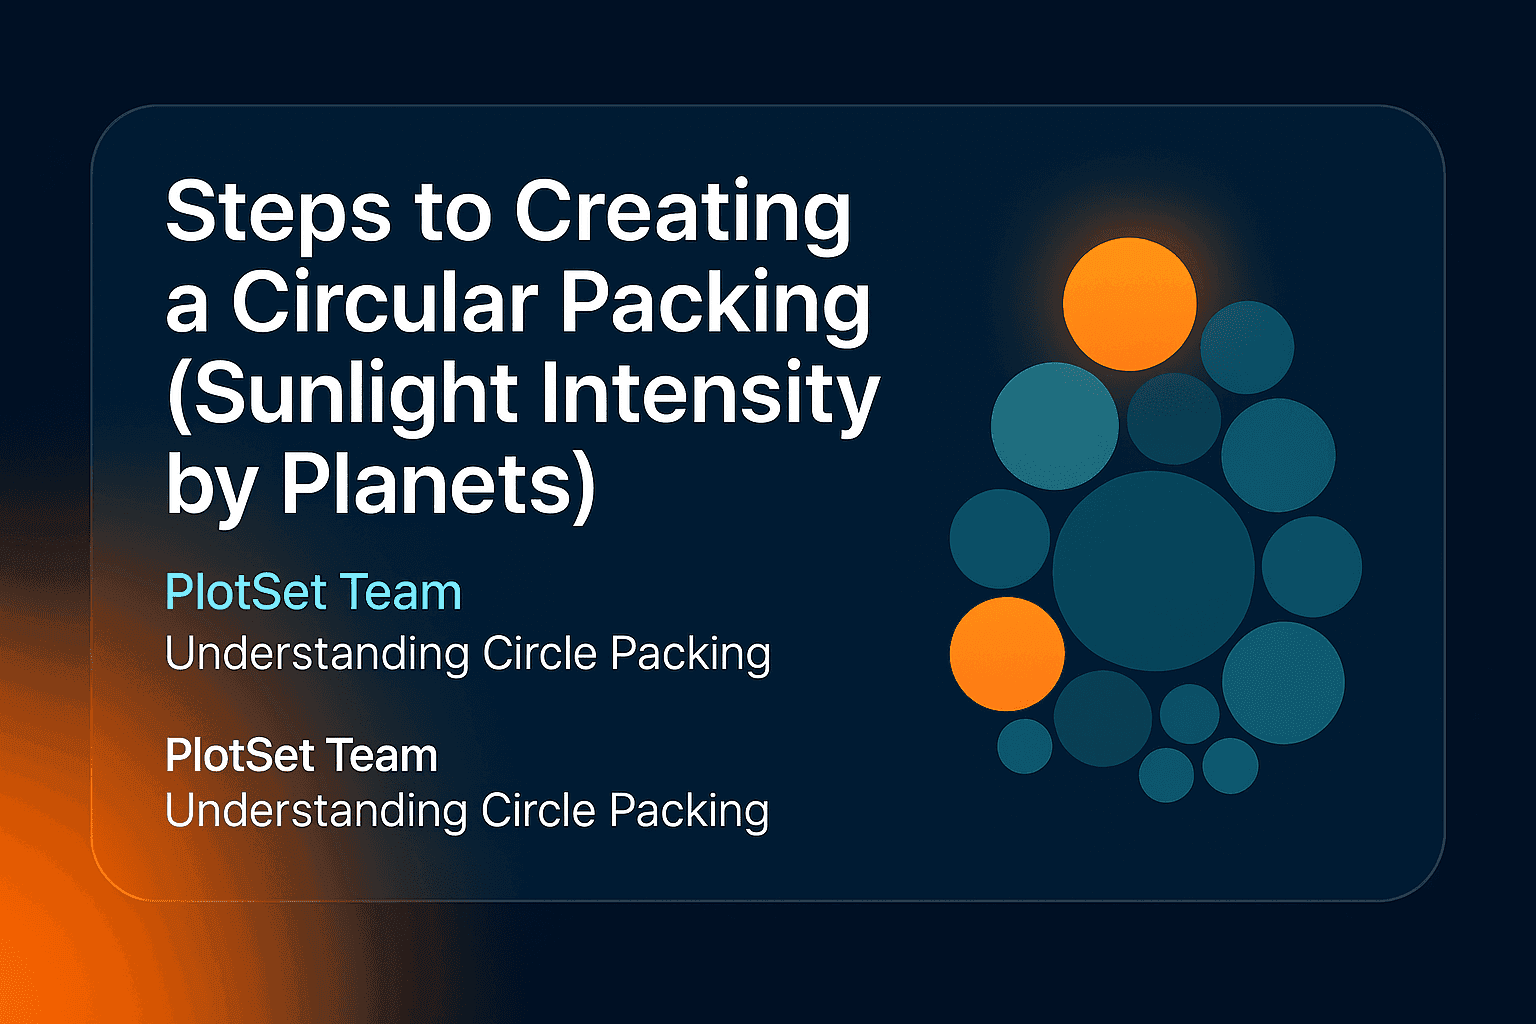
A circle packing chart shows each category as a circle whose area is proportional to its value, with the circles nested or packed tightly together. It trades the precise axes of a bar chart for an immediate sense of scale: one glance tells you which circles dominate and which barely register. That makes it the right chart when the differences are enormous — exactly the case in the example below.
The example: sunlight intensity received by the planets
How much sunlight does each planet get? NASA's Planetary Fact Sheet reports solar irradiance — the power arriving per square metre — for every planet. Sunlight weakens with the square of distance, so the numbers collapse fast:
| Planet | Solar irradiance (W/m²) |
|---|---|
| Mercury | 9,082.7 |
| Venus | 2,601.3 |
| Earth | 1,361.0 |
| Mars | 586.2 |
| Jupiter | 50.26 |
| Saturn | 14.82 |
| Uranus | 3.69 |
| Neptune | 1.508 |
Mercury receives about 6,000 times the sunlight of Neptune. A bar chart of these values is one tall bar and seven slivers; packed circles make the inverse-square law itself the picture.
Mercury's circle swallows the inner planets, and the four outer planets shrink to dots you can barely see — which is the honest story. Click a circle in the live chart to zoom in and read the small ones.
How to create a circle packing chart
- Prepare three columns. A group column, a label column and a numeric value: here,
Group, Planet, Solar irradiance. Every row becomes one circle. - Open the Circles template. In PlotSet, create a new project from the circle packing template; sample data is already bound so you can see the layout immediately.
- Upload or paste your data. Upload a CSV, paste from a spreadsheet, or connect a Google Sheet by URL so the chart can be re-synced later.
- Check the bindings. Labels to your name column, Values to the numbers, and Group to the group column — grouping is what colours the inner and outer planets differently.
- Style it. Pick a palette, keep a little padding between circles, and leave labels on automatic so they hide in circles too small to hold them.
- Publish. You get an interactive, zoomable chart with a tooltip on every circle, an embed code for any site, and PNG, SVG or JPG export.
When to use circle packing (and when not to)
Use it when values span orders of magnitude, when you have many categories, or when the audience needs impact more than precision — the same territory as a treemap, but friendlier and less boxy. Circle packing also handles hierarchy: circles can nest inside parent circles, like a sunburst chart flattened into bubbles.
Avoid it when readers must compare close values — circle areas within about 20% of each other look identical — or when the data is a time series. For scattered values with two numeric axes, use a bubble chart instead; for a force-simulated variant, see our force-directed circle packing tutorial.
FAQ
What is the difference between circle packing and a bubble chart?
A bubble chart positions circles on x and y axes, so position carries meaning. Circle packing ignores axes and simply packs the circles together; only the area means anything.
Can circle packing show hierarchy?
Yes. With a nesting column, child circles draw inside their parent's circle, which is why the layout is also called a nested circles diagram. Our example keeps one level and uses colour for the inner/outer grouping instead.
Why do small values disappear in a circle packing chart?
Because area scales with the value, a value 1,000 times smaller gets a circle about 32 times smaller in radius. That is the chart being honest; use the zoom or a tooltip to read the small circles, or switch to a log-scaled bar chart if every value must stay legible.
Is a circle packing chart accurate for comparisons?
It is accurate but not precise: people judge areas roughly, so use it when the point is magnitude, not decimals. See choosing the right chart for your data for how to decide.