| question_text | question_type | answers_raw | fallback_value | context_text | image | weight_co2 | ||
|---|---|---|---|---|---|---|---|---|
| How many miles do you drive per week? | number | 50 | Include commuting and errands | 0.4 | ||||
| How often do you fly each year? | slider | "0 | 10 | 1" | 2 | Return trips count as two | 250 | |
| What is your diet? | dropdown | Vegan|Vegetarian|Mixed|Meat heavy | Mixed | 1 | ||||
| How many people live in your home? | rating | 5 | 2 |

How to Create an Online Calculator
A step by step walkthrough for turning a spreadsheet of questions into a published, embeddable calculator in PlotSet, with a formula that computes a result from visitors' answers.
Unos 10 minutosA short sequence of questions followed by a computed result, such as a score, an estimate or a recommendation, ready to embed on your page: that is what you will have. Each row of a spreadsheet becomes one question, and a formula you write turns the answers into a number.
Expect about ten minutes. Most of it is deciding the questions and the formula, since the template does the rest. Test it with a few known inputs before you publish.
Los datos que necesitas
One row per question with a question text and type, then optional answer options, a default answer, help text, an image URL and extra numeric columns such as a weight.
Question type must be one of text, number, dropdown, date, rating, slider or buttons. Anything else becomes a text box.
For dropdown and buttons, separate options with a pipe. Use label=value to store a value different from the label.
For rating, give the number of icons. For slider, give min,max,step, such as 0,10,1.
Extra numeric columns, such as a weight, are available in the formula as q1_weight, named by question number and column header.
Los pasos
El camino exacto en PlotSet, desde una plantilla en blanco hasta el gráfico terminado.
- 01
Open the Calculator template
From the PlotSet dashboard, start a new project and choose Calculator from the Other category. It loads with an eight-question sample so you can see every question type working.

Todas las guías empiezan aquí. Elige la categoría y luego la plantilla. Es la misma cuadrícula sea cual sea el tipo de gráfico que busques. - 02
Write your questions
Give each question a prompt and a type, then add options, a sensible default and a line of help text where it helps. Keep each question short and answerable in one move.
- 03
Upload the file, or connect it live
Import a CSV or .xlsx file from the data panel, paste rows from a spreadsheet, or connect a Google Sheet so changes to the questions flow through. The first row is read as the headers.

La vista de datos, aquí en un proyecto de gráfico de barras. Sube un CSV, saca los números de una imagen con Magic Import o sincroniza una Google Sheet. El panel es el mismo en todos los tipos de gráfico. - 04
Check the column bindings
Confirm which column is the question text, type, options, default, help text, image and extra data. This is usually right automatically when the headers are clear.

Las asignaciones deciden qué columna se convierte en la etiqueta, cuál aporta los valores y cuál define el color. Auto Binding las deduce de tus encabezados, así que revísalas en lugar de darlas por buenas. - 05
Write the result formula
Open the Submit and result tab. In the variables box add one name equals expression line per value, referring to answers as q1, q2 and so on. Then write the result text and put the names in double curly brackets.

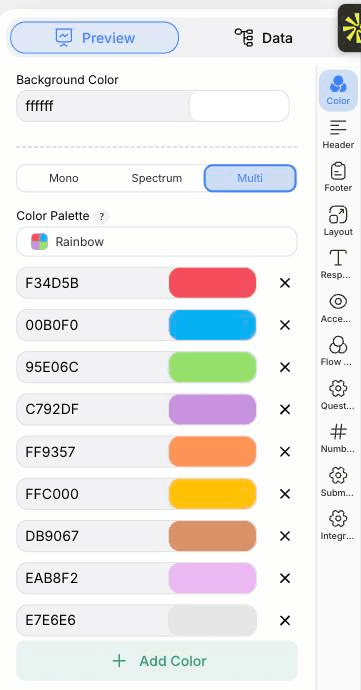
La pestaña Preview de un gráfico de tipo Calculator. Todos los controles de estilo están en el panel enmarcado: apariencia, encabezado, pie de página y las opciones propias de este tipo de gráfico, cada grupo en su propia pestaña. - 06
Choose the flow
In the Flow and design tab, show one question at a time with Back and Next buttons, or all questions on one page. Style the card, buttons and inputs to match your site.
- 07
Style the question types
The Question types tab styles each control separately: text and number inputs, dropdowns, rating icons, sliders and button groups.
- 08
Test it, then publish
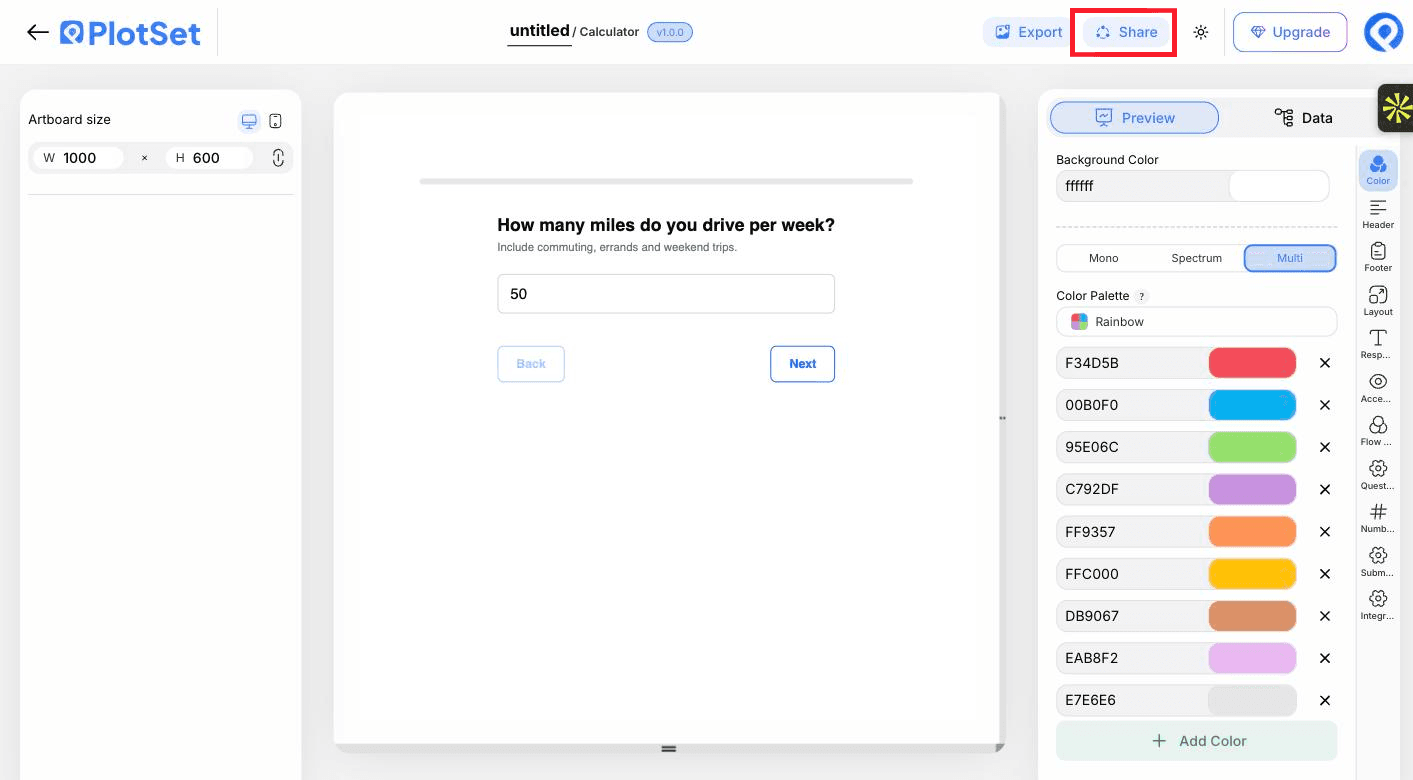
Answer every question with known values and check the result against a hand calculation. Then publish and copy the embed code from the Share dialog.

Share es lo que convierte un gráfico terminado en un enlace público y un código de incrustación.
Empieza con la plantilla de Calculator, que ya trae datos de ejemplo cargados, y sustitúyelos por los tuyos.
Abrir la plantillaConsejos de estilo para un Calculator
Test with round numbers
Use inputs whose answer you can work out in your head, so a wrong formula is obvious.
Give honest defaults
An untouched question uses its default, so pick the most common answer rather than zero.
Name your variables
Build the result in named steps, such as driving, flights and total, so the formula stays readable.
Format the result
Use the Number and date format tab to set prefixes, suffixes and decimals so the result reads as a cost, a percentage or a weight.
Errores comunes al hacer un Calculator
The result shows zero
A line in the formula is probably malformed, and a bad line silently evaluates to zero. Check the spelling of each name and bracket.
A question appears as a text box
The type was misspelled or missing, so it fell back to text. Check it matches one of the seven types exactly.
The numbers shifted after reordering
Formulas use q1, q2 and so on by sheet order. If you move rows, update the formula.
The exported image does not match the live chart
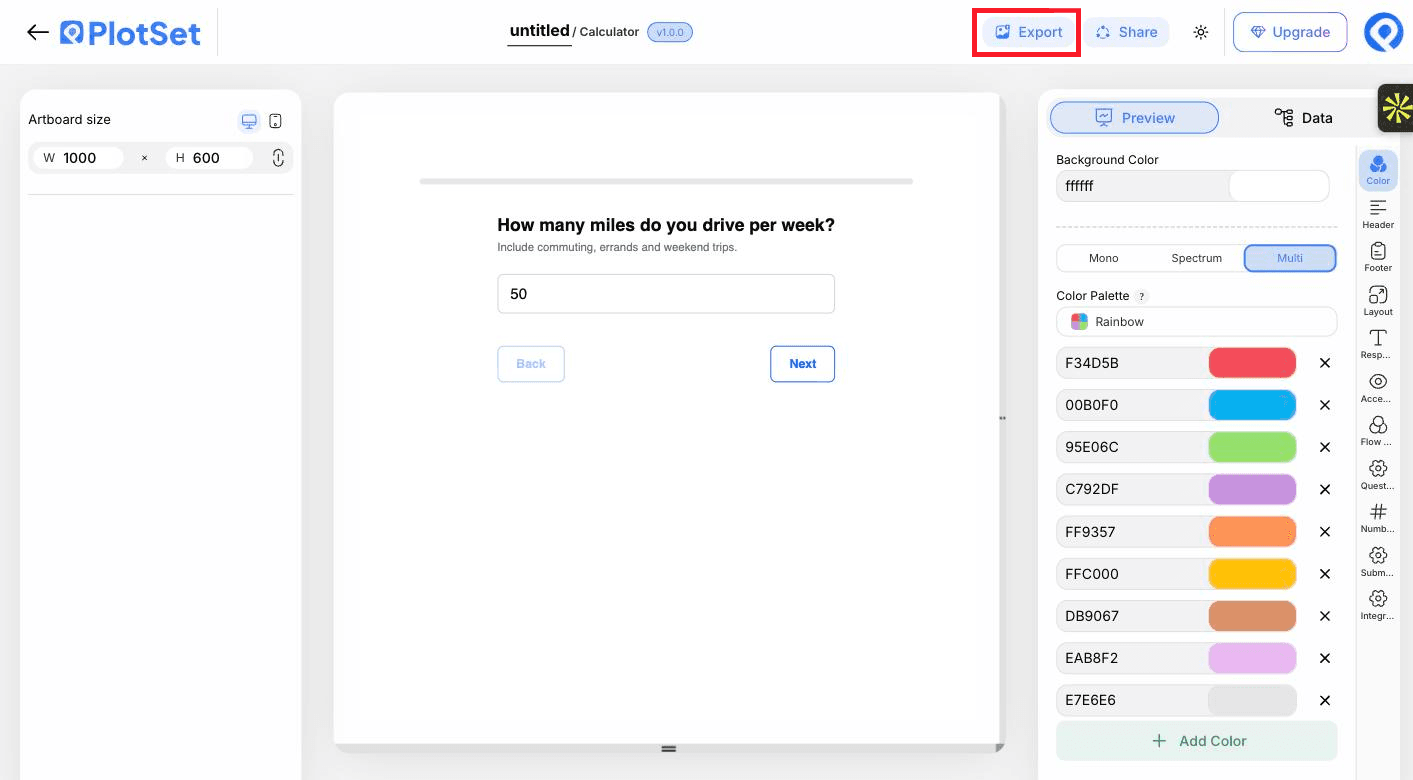
The static export redraws the current state approximately. Use the live embed for the real experience.
Aprende más sobre el Calculator
¿No estás seguro de que el Calculator sea la opción correcta? Descubre qué es, cuándo usarlo y cuándo no.
Calculator: preguntas frecuentes
A question text and a question type for each row. Options, defaults, help text, an image and extra numeric columns are optional.
Crea tu Calculator ahora
Gratis para empezar con más de 300 plantillas. No se necesita tarjeta de crédito.