
Cada gráfico empezó como una hoja de cálculo.
Mapas, bar chart races, treemaps, pictogramas y más. Abre uno y rehazlo con tus datos.
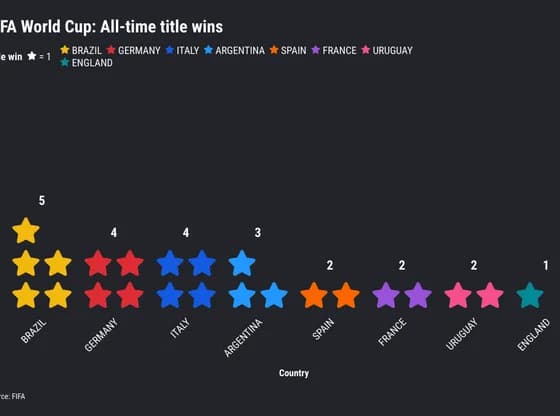 PictogramFIFA World Cup: All-time title wins
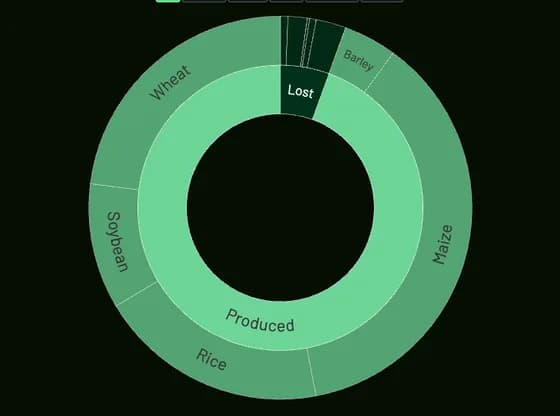 Hierarchy616.4 trillion kcal were lost
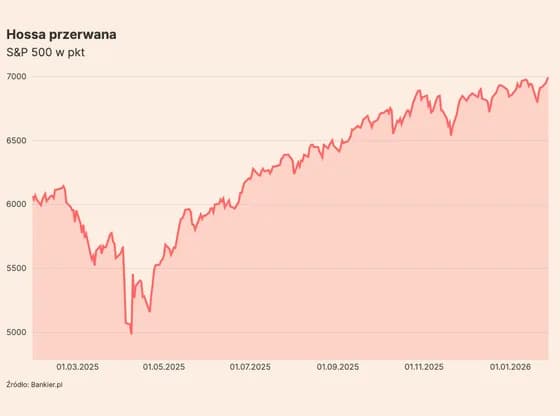 Line, bar and pie chartsHossa przerwana
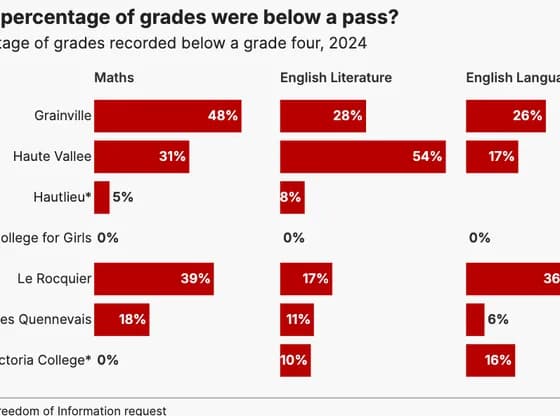 Line, bar and pie chartsWhat percentage of grades were below a pass?
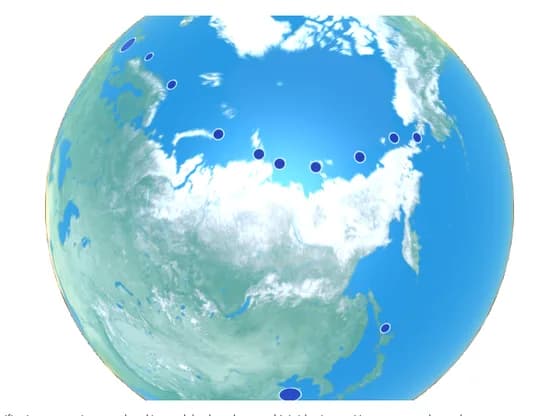 3D globeDubai Tower's journey along the 'Ice Silk Road'
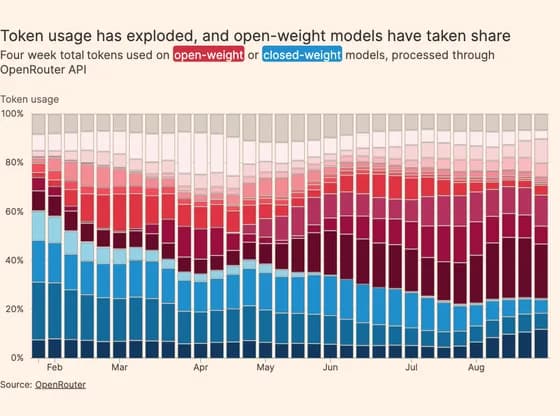 Line, bar and pie chartsToken usage has exploded, and open-weight models have taken share
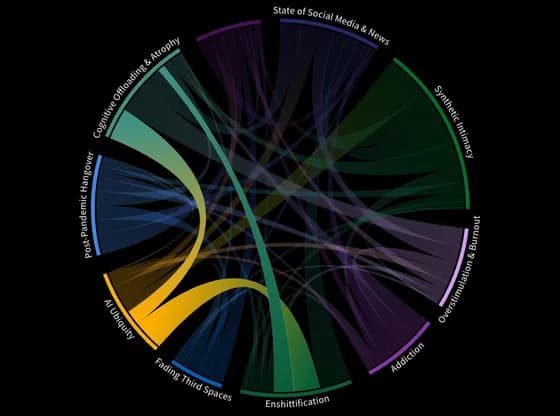 Network graphSeptember+disconnect, loneliness, state of social
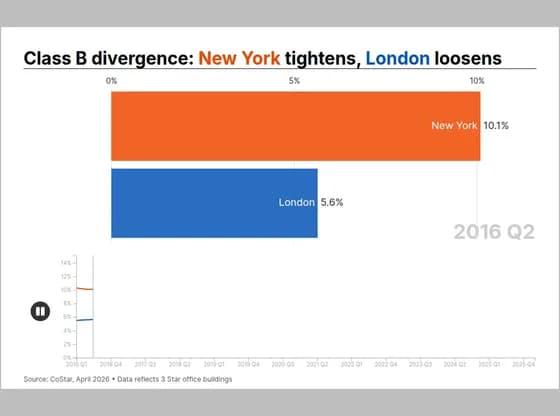 Animated chartsClass B divergence: New York tightens, London loosens
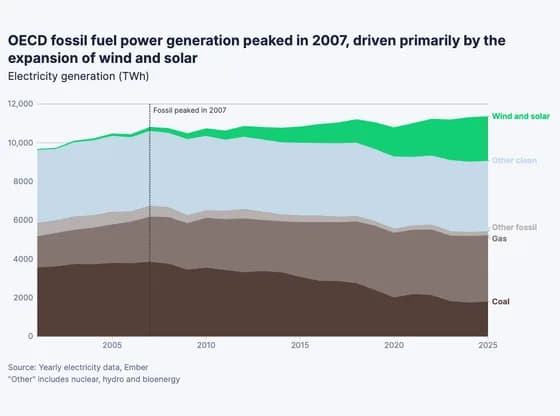 Line, bar and pie chartsOECD fossil fuel power generation peaked in 2007, driven primarily by the expansion of wind and…
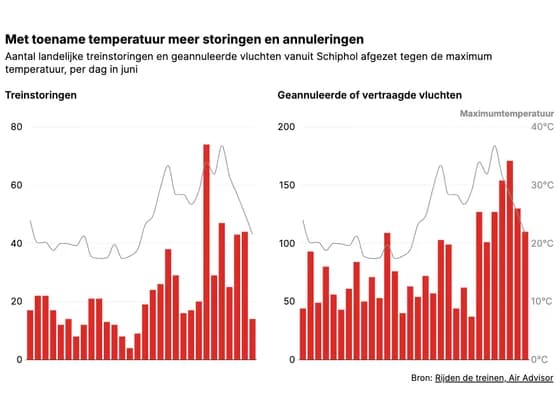 Line, bar and pie chartsMet toename temperatuur meer storingen en annuleringen
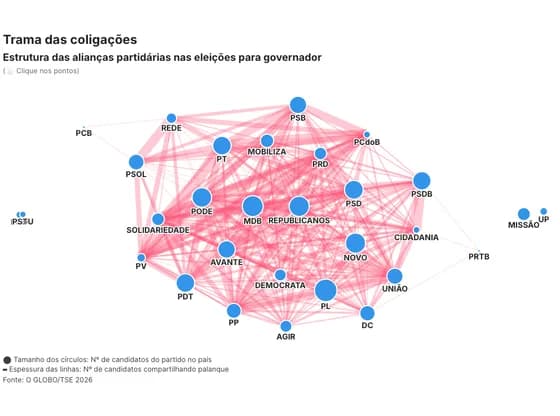 Network graphTrama das coligações
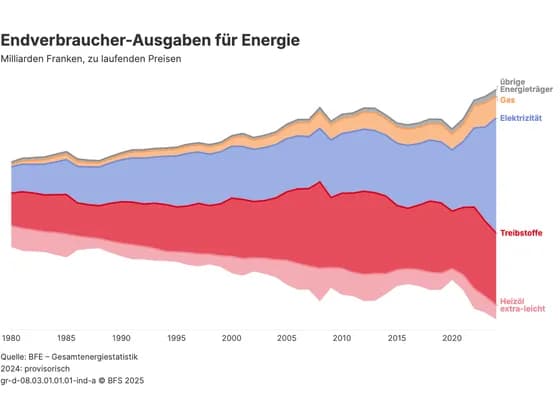 Line, bar and pie chartsEndverbraucher-Ausgaben für Energie
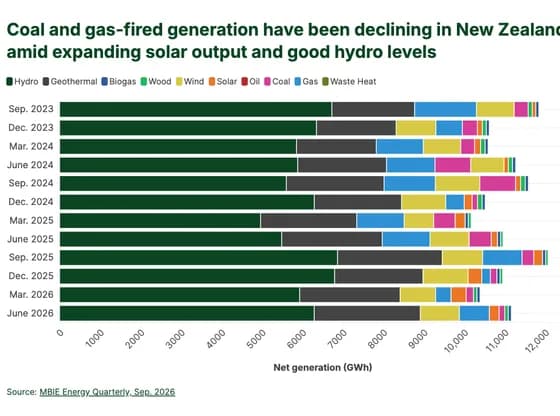 Line, bar and pie chartsCoal and gas-fired generation have been declining in New Zealand amid expanding solar output and…
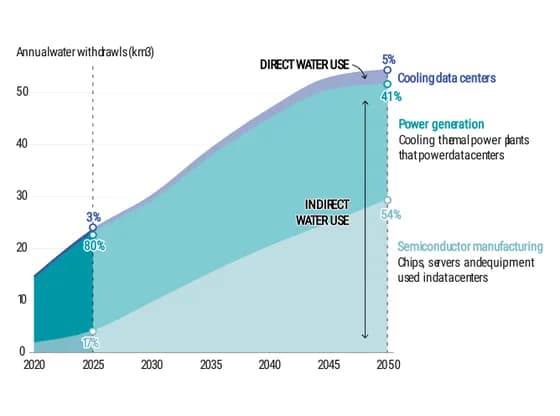 Interactive SVGWater demand for AI is projected to more than double between now and 2050, with the majority of…
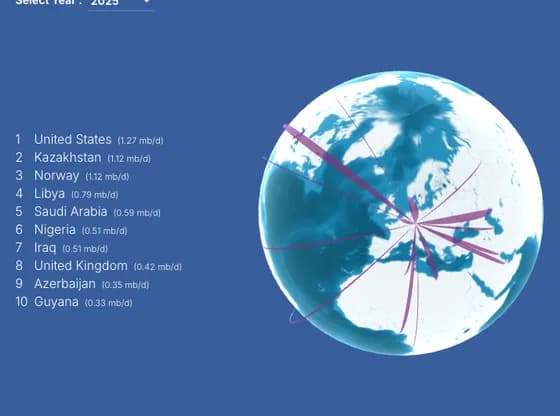 Connections and flow mapsEU-27 External Crude Oil Imports (2019–2025)
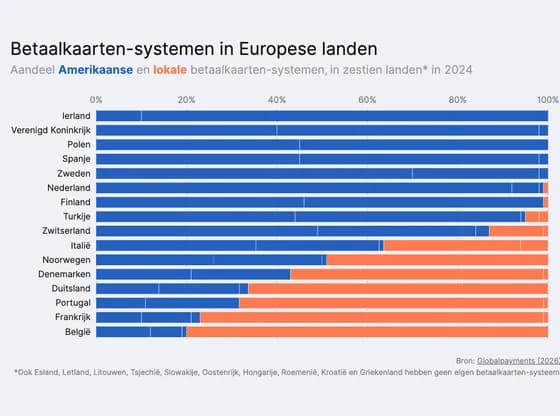 Line, bar and pie chartsBetaalkaarten-systemen in Europese landen
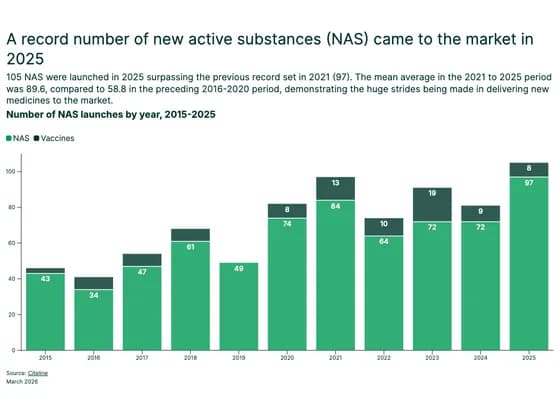 Line, bar and pie chartsA record number of new active substances (NAS) came to the market in 2025
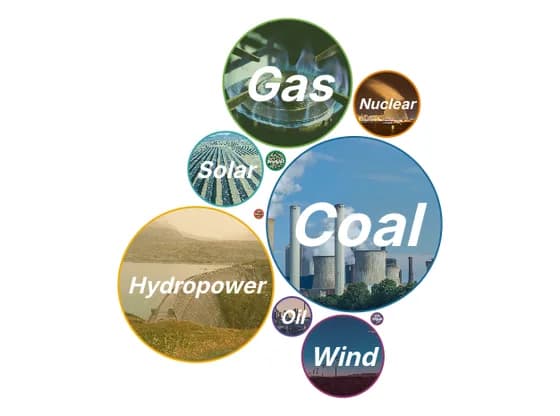 Distribution chartsInstalled capacity of global power plants financed by Chinese foreign direct investment and/or…
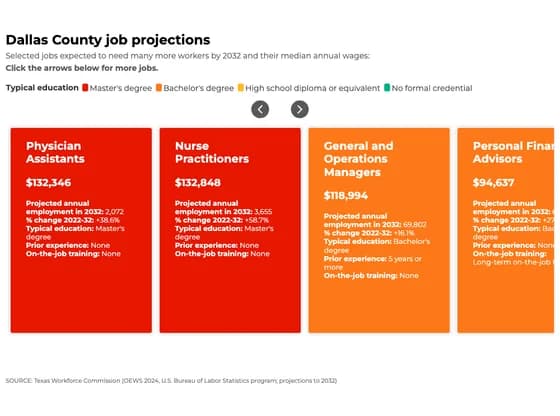 CardsDallas County job projections
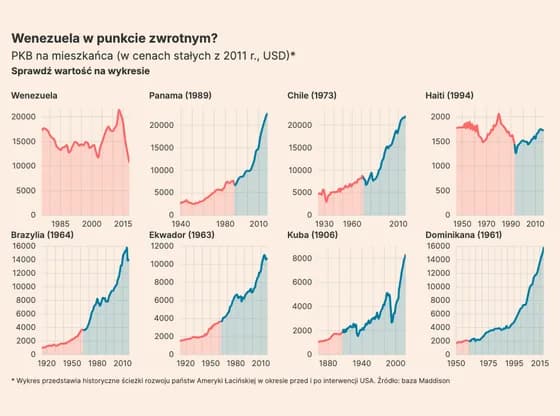 Line, bar and pie chartsWenezuela w punkcie zwrotnym?