
Cada gráfico empezó como una hoja de cálculo.
Mapas, bar chart races, treemaps, pictogramas y más. Abre uno y rehazlo con tus datos.
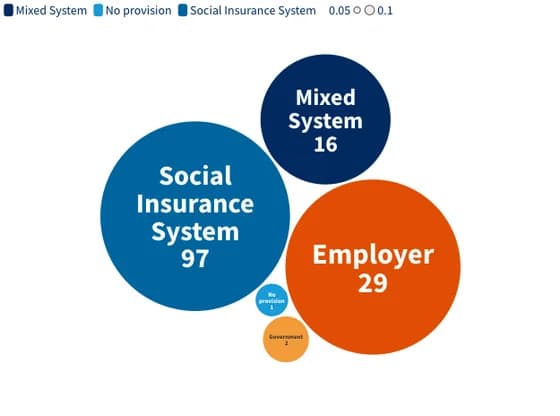 Distribution chartsWho Pays for Maternity Leave in 2025?
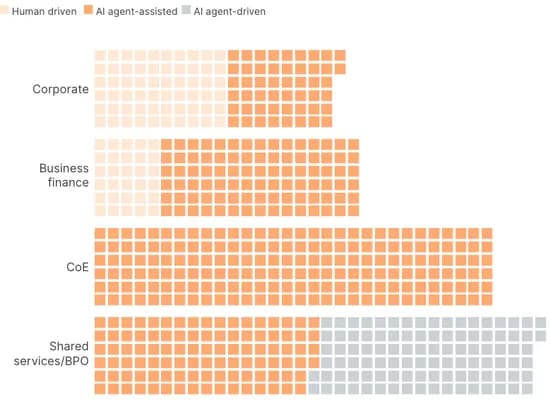 PictogramWhere AI agents make the biggest impact in finance
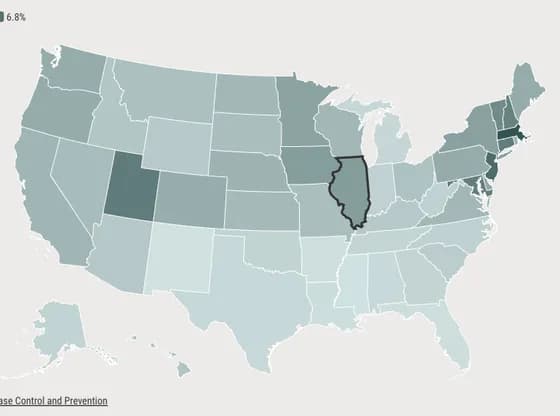 MapsIllinois had the 9th highest fertility treatment rate in 2023
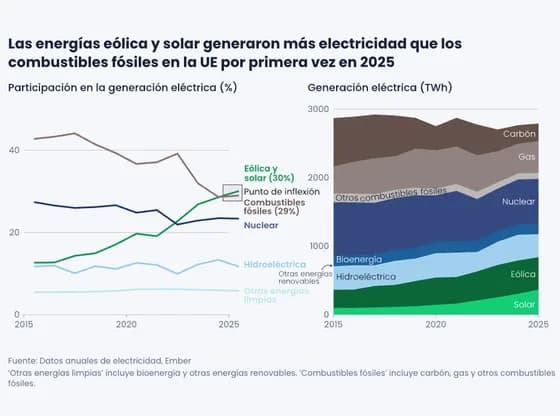 Interactive SVGLas energías eólica y solar generaron más electricidad que los combustibles fósiles en la UE por…
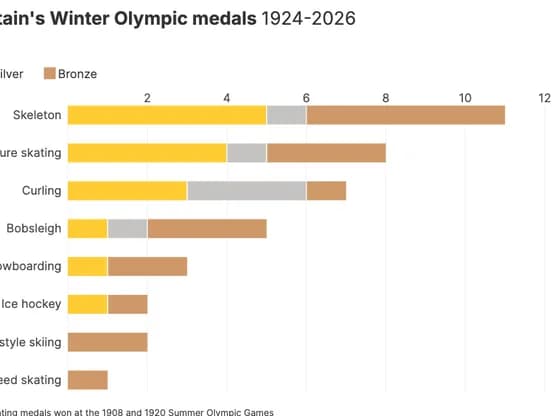 Line, bar and pie chartsGreat Britain's Winter Olympic medals 1924-2026
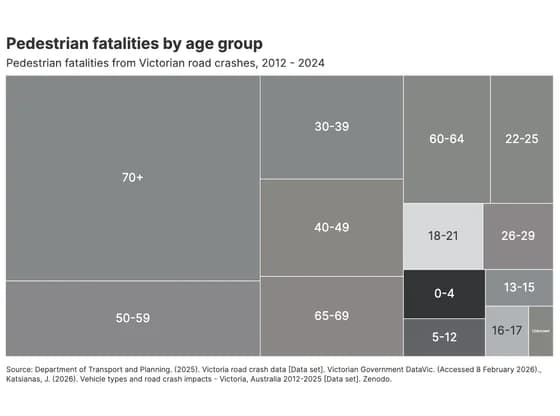 HierarchyPedestrian fatalities by age group
 3D globeCOP Cities – 1995 to 2025
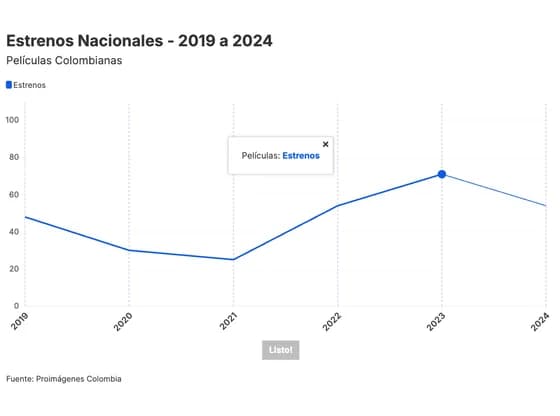 Interactive toolsEstrenos Nacionales - 2019 a 2024
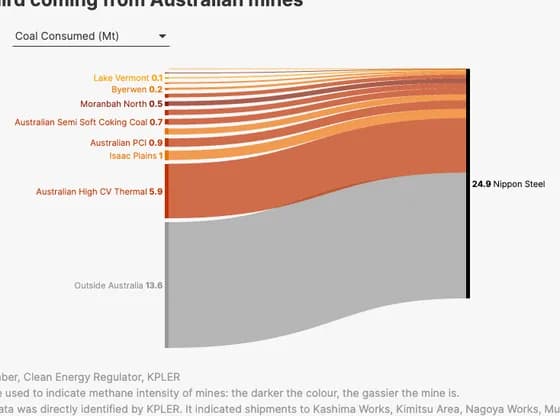 Sankey diagramNippon Steel's upstream coal methane emissions could be up to 165.9 kt, with one third coming…
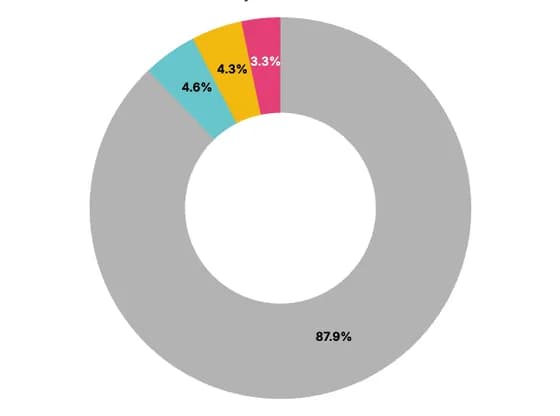 Line, bar and pie chartsCoal accounts for the largest share at ~88% of total generation
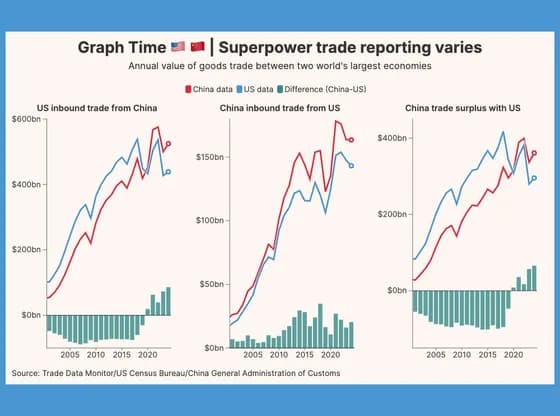 Line, bar and pie chartsGraph Time 🇺🇸 🇨🇳 | Superpower trade reporting varies
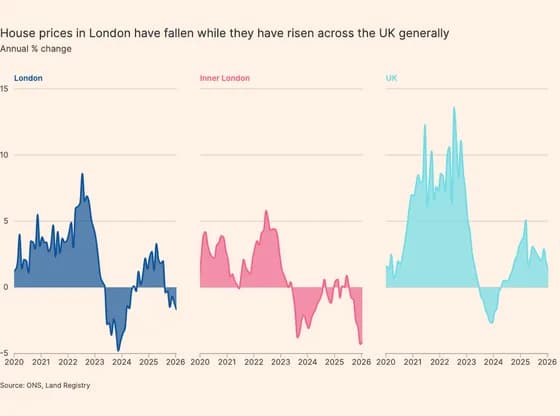 Line, bar and pie chartsHouse prices in London have fallen while they have risen across the UK generally
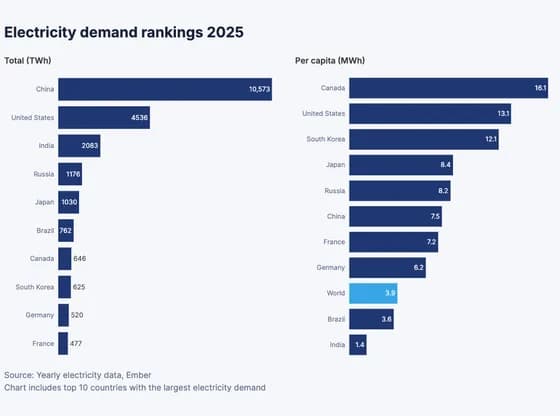 Line, bar and pie chartsElectricity demand rankings 2025
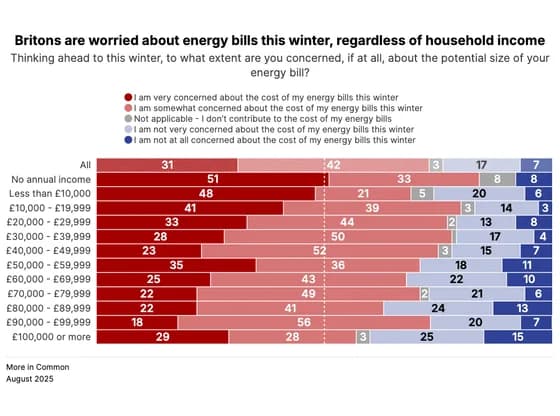 Line, bar and pie chartsBritons are worried about energy bills this winter, regardless of household income
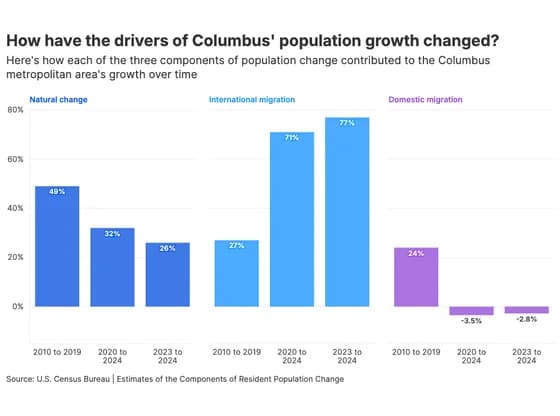 Line, bar and pie chartsHow have the drivers of Columbus' population growth changed?
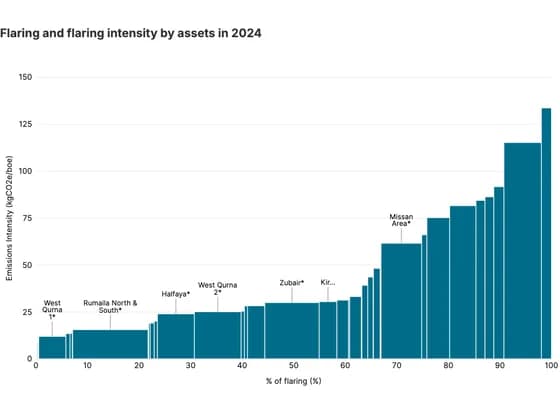 MarimekkoFlaring and flaring intensity by assets in 2024
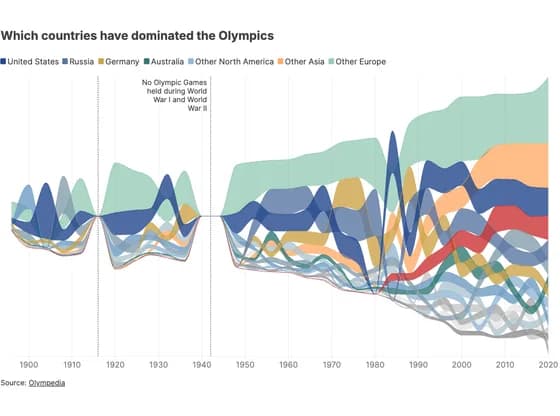 Line, bar and pie chartsWhich countries have dominated the Olympics
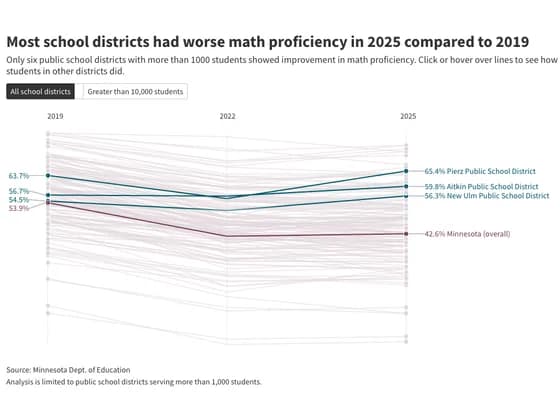 Slope chartMost school districts had worse math proficiency in 2025 compared to 2019
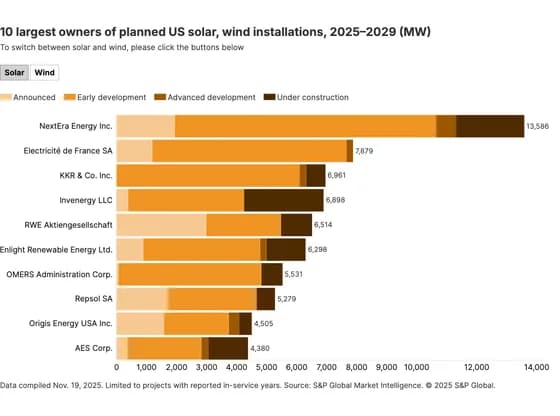 Line, bar and pie charts10 largest owners of planned US solar, wind installations, 2025–2029 (MW)
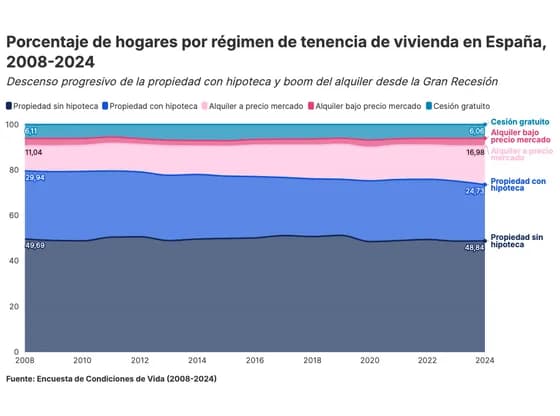 Line, bar and pie chartsPorcentaje de hogares por régimen de tenencia de vivienda en España, 2008-2024