
Cada gráfico empezó como una hoja de cálculo.
Mapas, bar chart races, treemaps, pictogramas y más. Abre uno y rehazlo con tus datos.
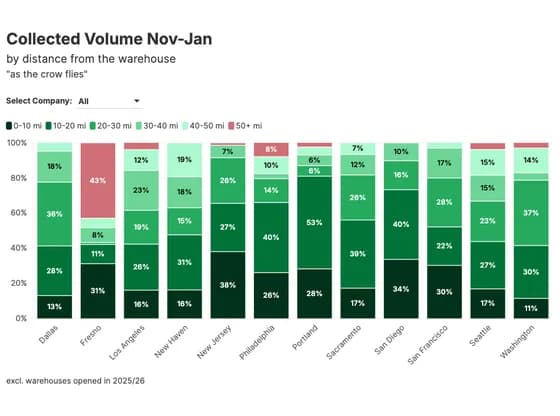 Line, bar and pie chartsCollected Volume Nov-Jan
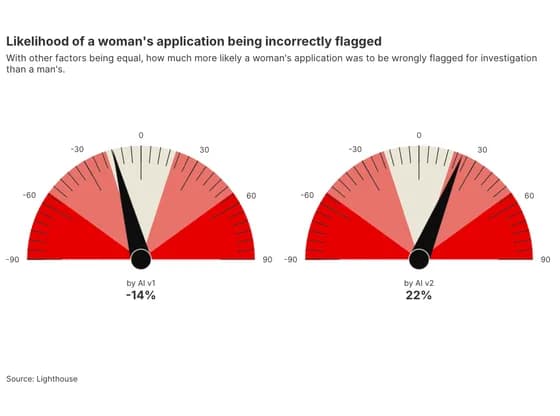 Counters and gaugesLikelihood of a woman's application being incorrectly flagged
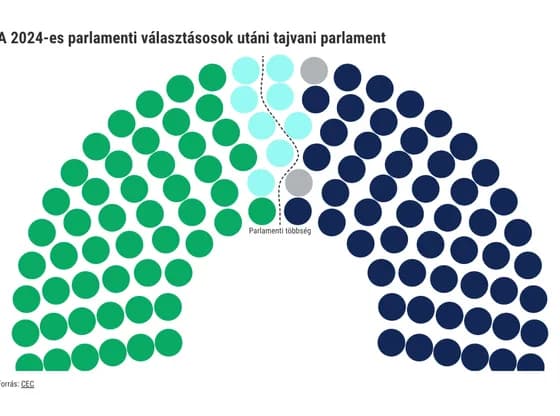 Elections and parliamentsA 2024-es parlamenti választásosok utáni tajvani parlament
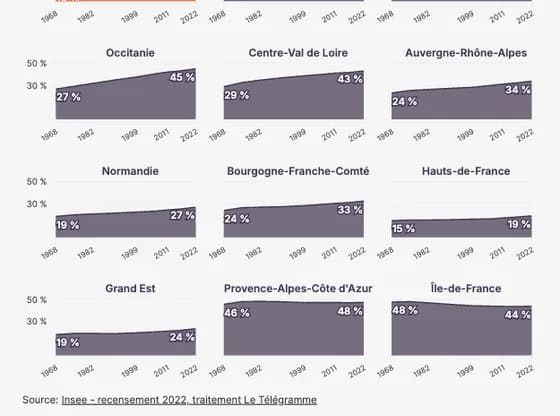 Line, bar and pie chartsDans l'Hexagone, la part de personnes nées ailleurs progresse partout hors Île-de-France, et…
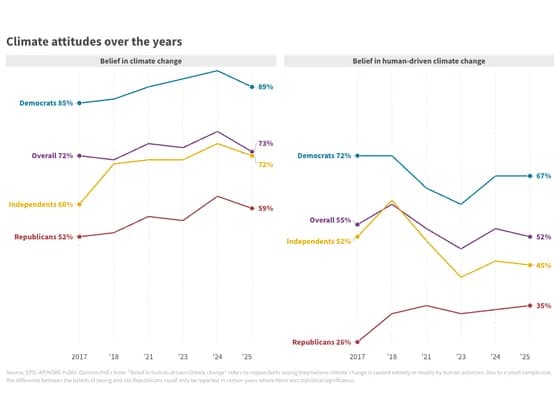 Slope chartClimate attitudes over the years
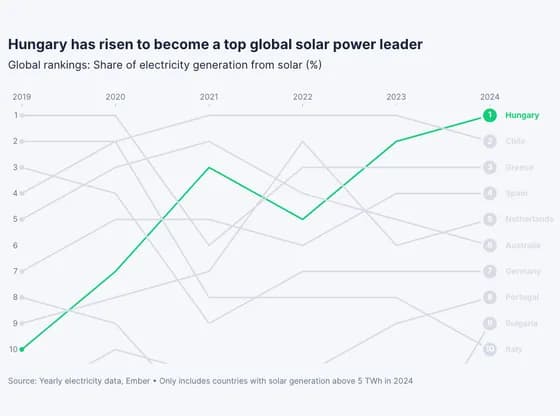 Animated chartsHungary has risen to become a top global solar power leader
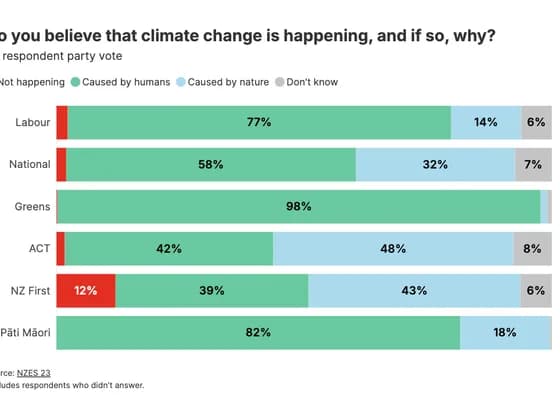 Line, bar and pie chartsDo you believe that climate change is happening, and if so, why?
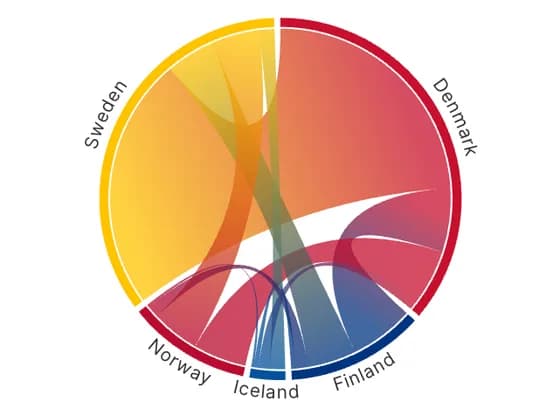 Network graphFlows of Musicians between the Nordic Countries
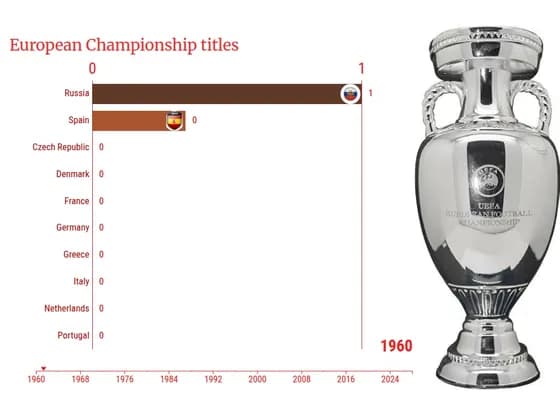 Animated chartsEuropean Championship titles
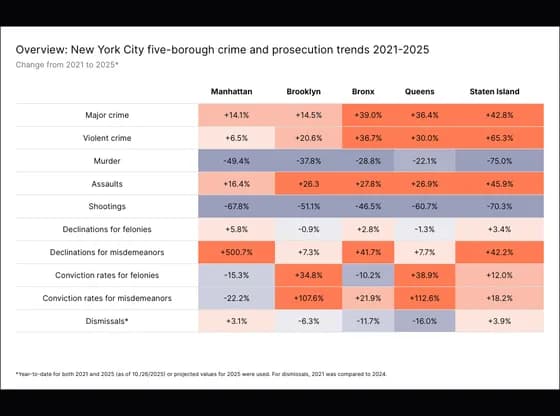 TableOverview: New York City five-borough crime and prosecution trends 2021-2025
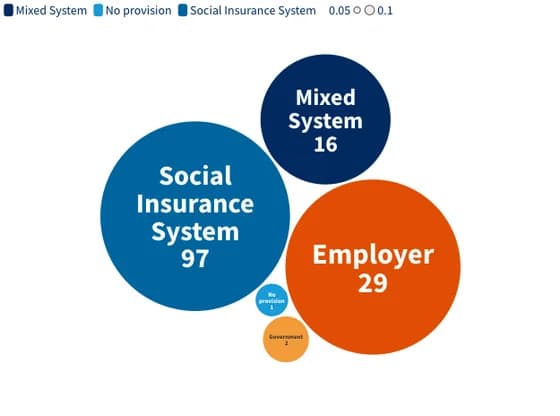 Distribution chartsWho Pays for Maternity Leave in 2025?
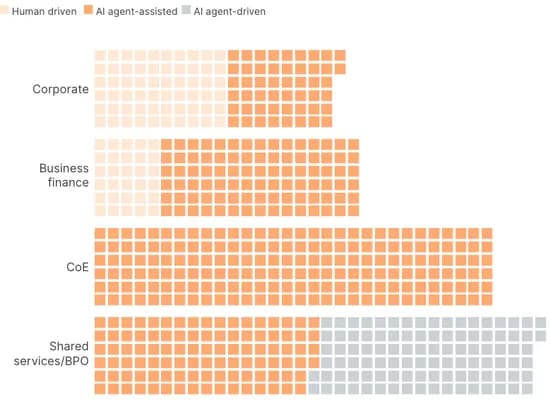 PictogramWhere AI agents make the biggest impact in finance
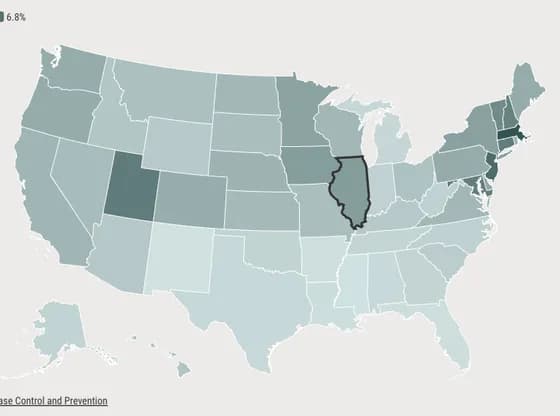 MapsIllinois had the 9th highest fertility treatment rate in 2023
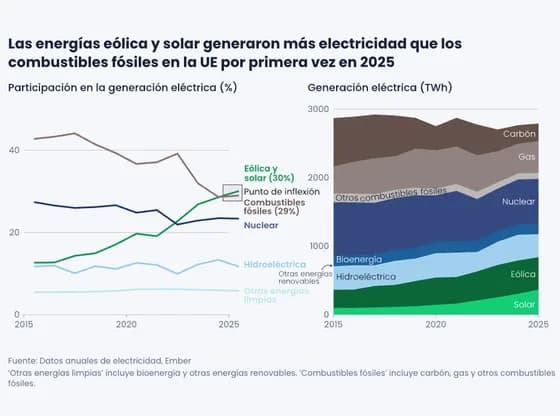 Interactive SVGLas energías eólica y solar generaron más electricidad que los combustibles fósiles en la UE por…
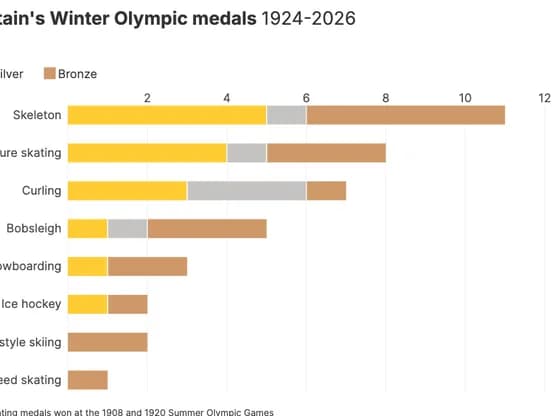 Line, bar and pie chartsGreat Britain's Winter Olympic medals 1924-2026
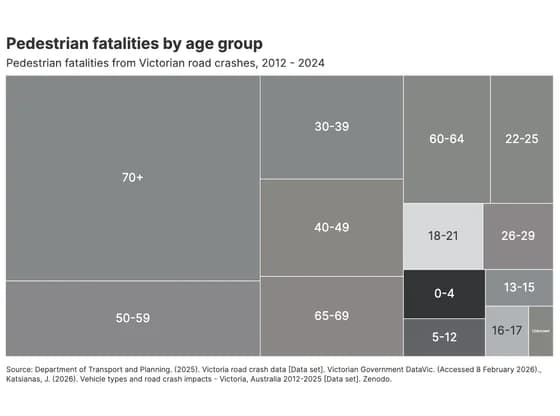 HierarchyPedestrian fatalities by age group
 3D globeCOP Cities – 1995 to 2025
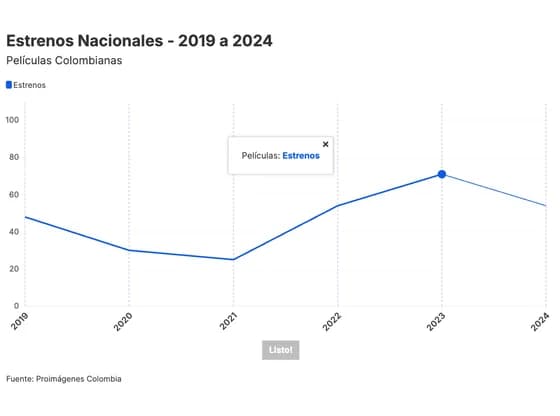 Interactive toolsEstrenos Nacionales - 2019 a 2024
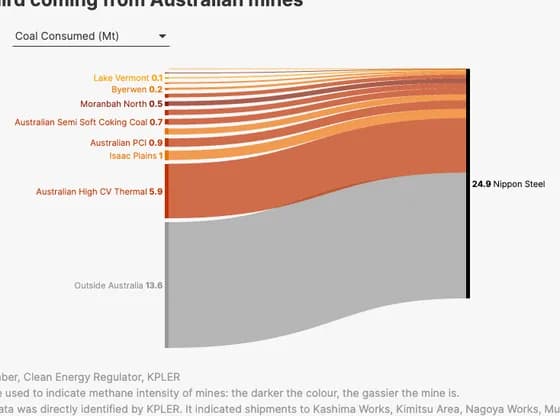 Sankey diagramNippon Steel's upstream coal methane emissions could be up to 165.9 kt, with one third coming…
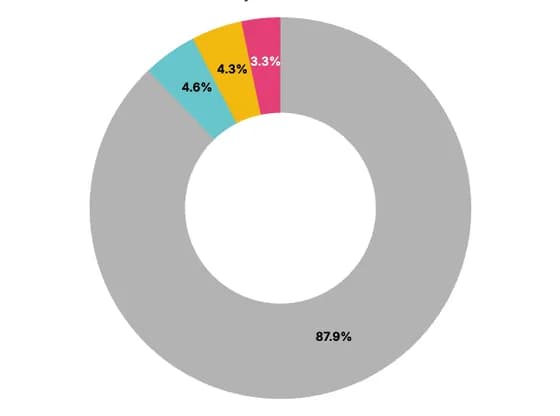 Line, bar and pie chartsCoal accounts for the largest share at ~88% of total generation