
Cada gráfico empezó como una hoja de cálculo.
Mapas, bar chart races, treemaps, pictogramas y más. Abre uno y rehazlo con tus datos.
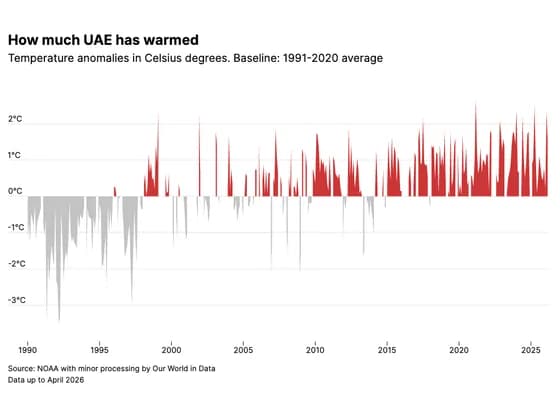 Line, bar and pie chartsHow much UAE has warmed
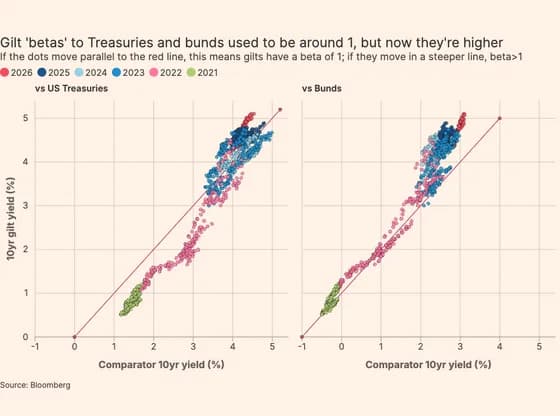 ScatterGilt 'betas' to Treasuries and bunds used to be around 1, but now they're higher
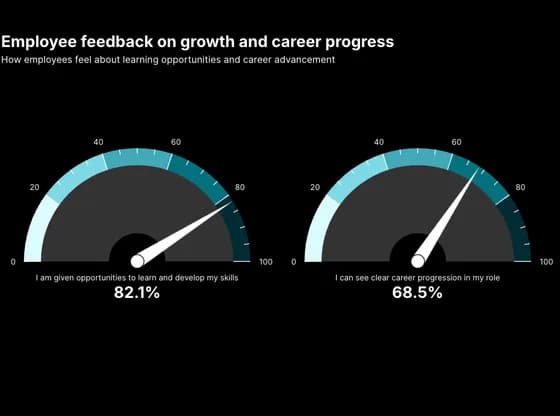 Counters and gaugesEmployee feedback on growth and career progress
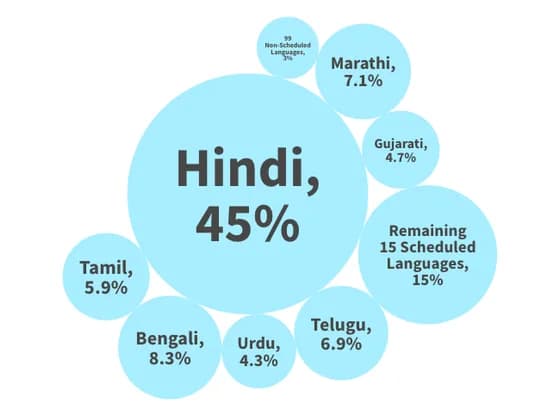 Distribution chartsIf Languages were States...
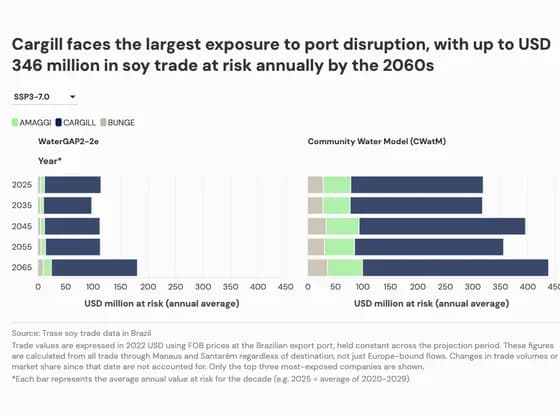 Line, bar and pie chartsCargill faces the largest exposure to port disruption, with up to USD 346 million in soy trade…
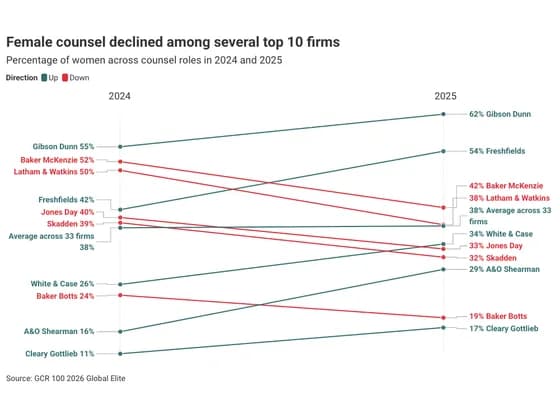 Slope chartFemale counsel declined among several top 10 firms
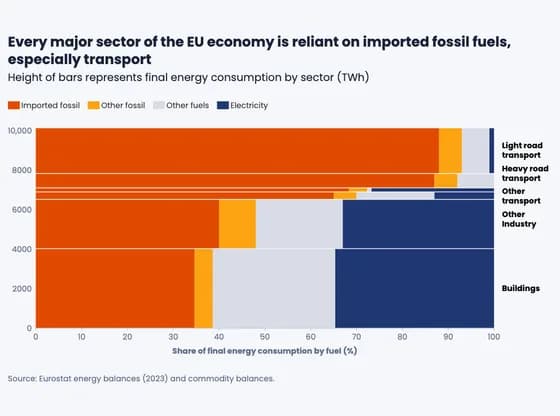 MarimekkoEvery major sector of the EU economy is reliant on imported fossil fuels, especially transport
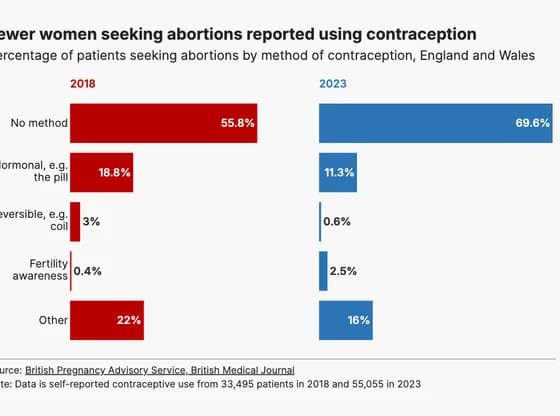 Line, bar and pie chartsFewer women seeking abortions reported using contraception
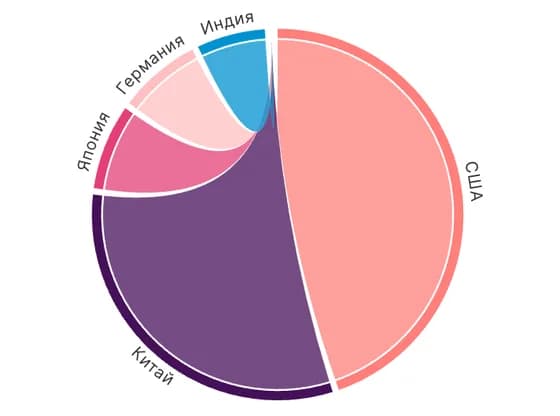 Network graphВВП по странам, млрд USD
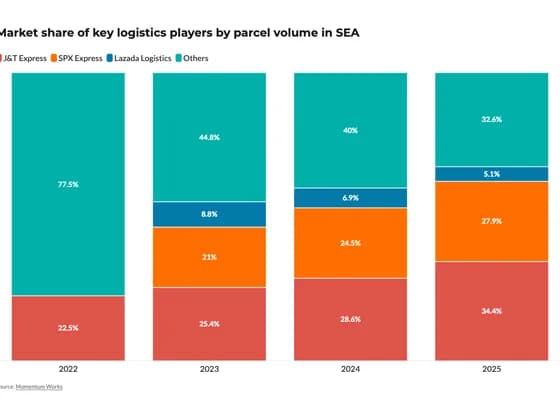 Line, bar and pie chartsMarket share of key logistics players by parcel volume in SEA
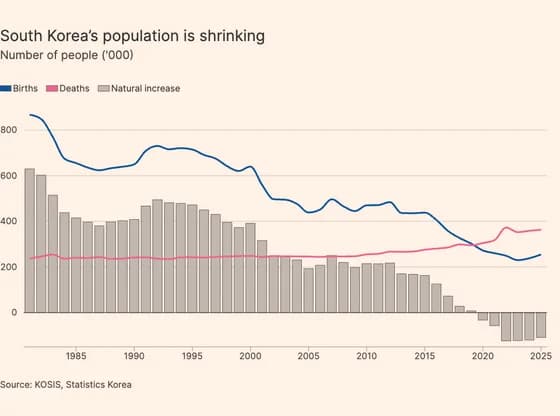 Line, bar and pie chartsSouth Korea’s population is shrinking
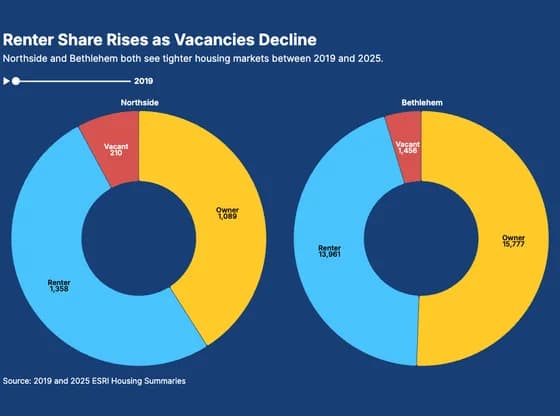 Line, bar and pie chartsRenter Share Rises as Vacancies Decline
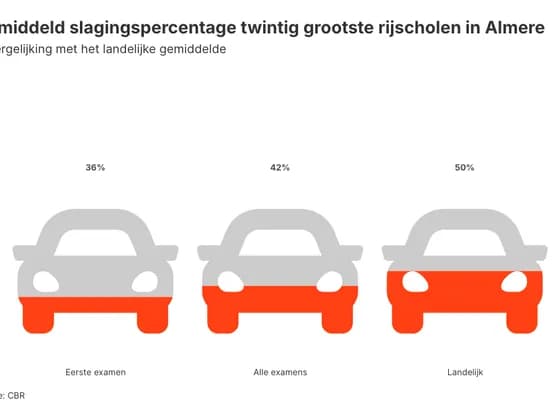 PictogramGemiddeld slagingspercentage twintig grootste rijscholen in Almere
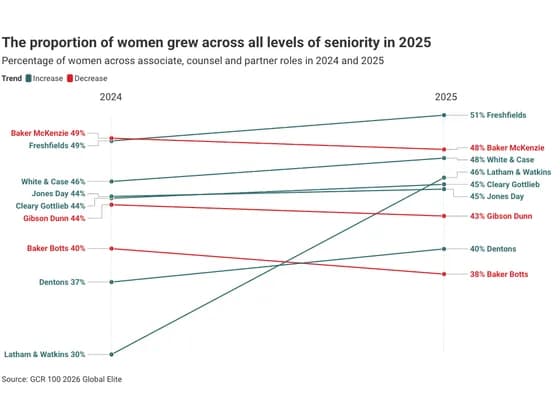 Slope chartThe proportion of women grew across all levels of seniority in 2025
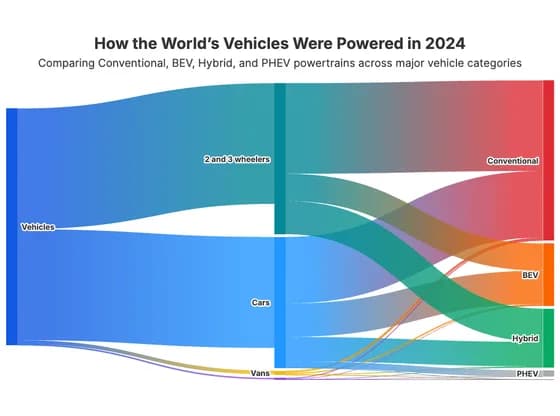 Sankey diagramHow the World’s Vehicles Were Powered in 2024
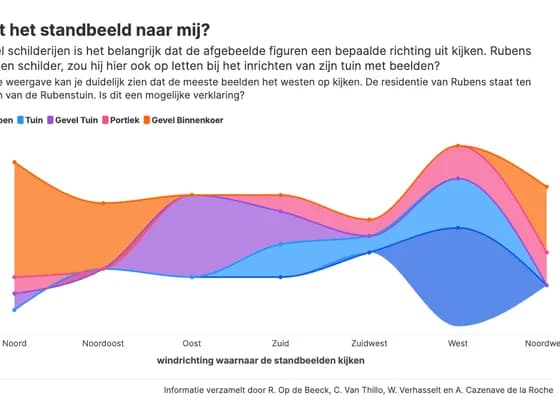 Line, bar and pie chartsKijkt het standbeeld naar mij?
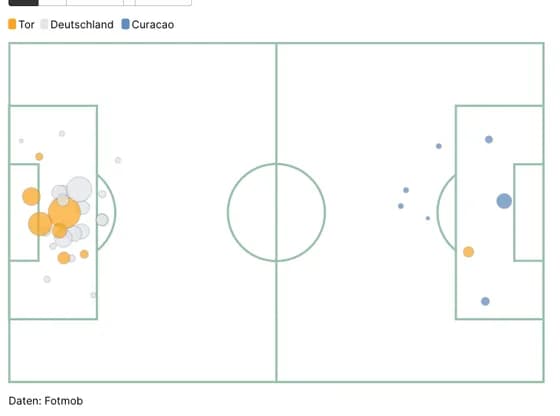 SportsDFB-Team Chancen vs Curacao
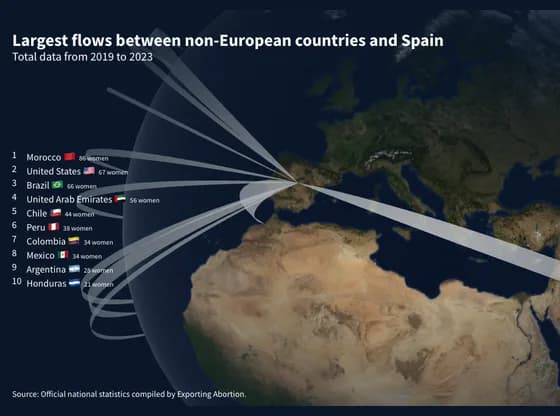 Connections and flow mapsLargest flows between non-European countries and Spain
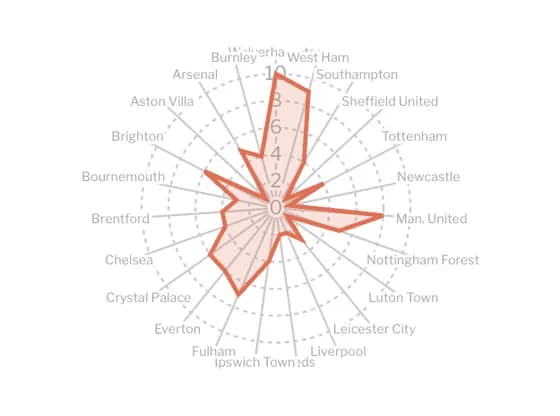 Radar chartDe 100 goals van Haaland tegen andere Premier League-ploegen
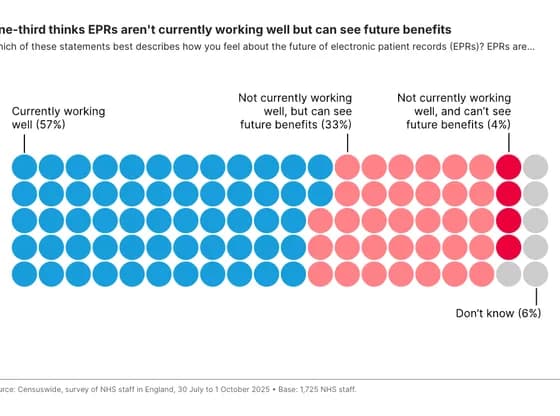 Interactive SVGOne-third thinks EPRs aren't currently working well but can see future benefits