
Cada gráfico empezó como una hoja de cálculo.
Mapas, bar chart races, treemaps, pictogramas y más. Abre uno y rehazlo con tus datos.
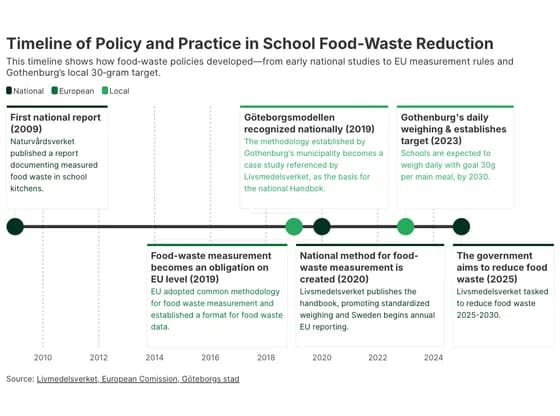 TimelineTimeline of Policy and Practice in School Food‑Waste Reduction
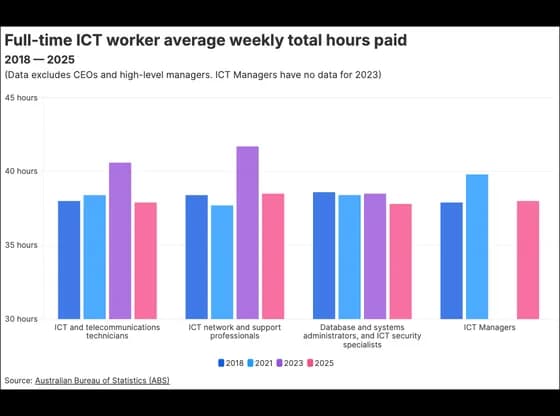 Line, bar and pie chartsFull-time ICT worker average weekly total hours paid
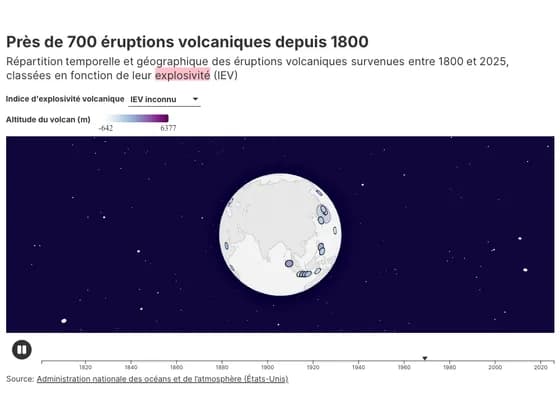 3D globePrès de 700 éruptions volcaniques depuis 1800
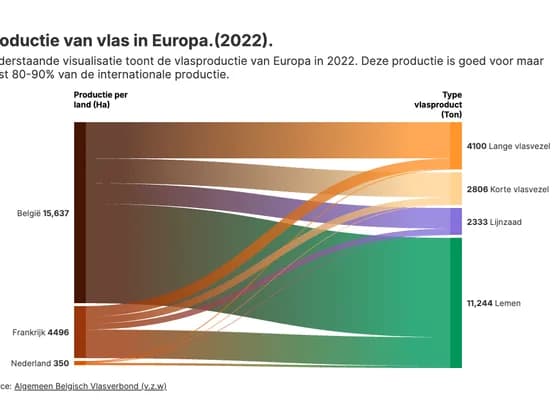 Sankey diagramProductie van vlas in Europa.(2022).
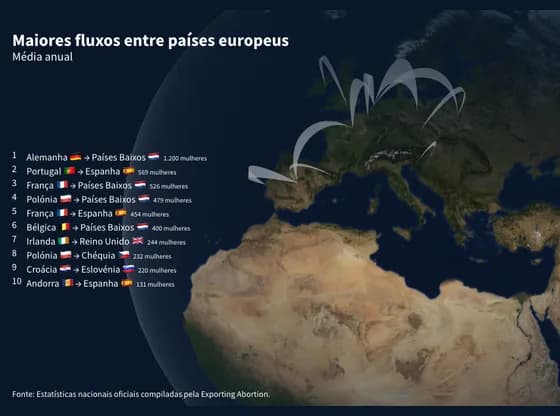 Connections and flow mapsMaiores fluxos entre países europeus
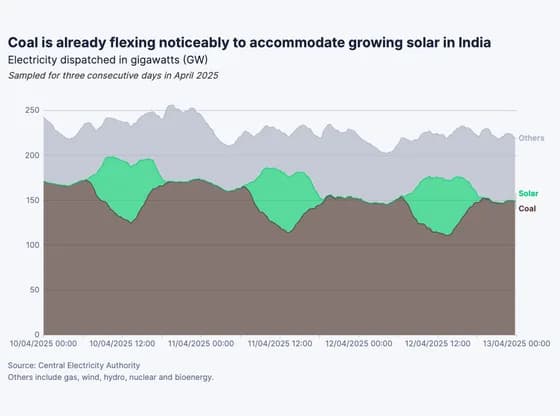 Line, bar and pie chartsCoal is already flexing noticeably to accommodate growing solar in India
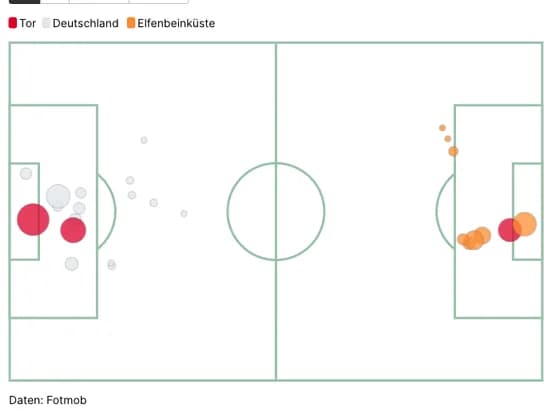 SportsDFB-Team Chancen vs Elfenbeinküste
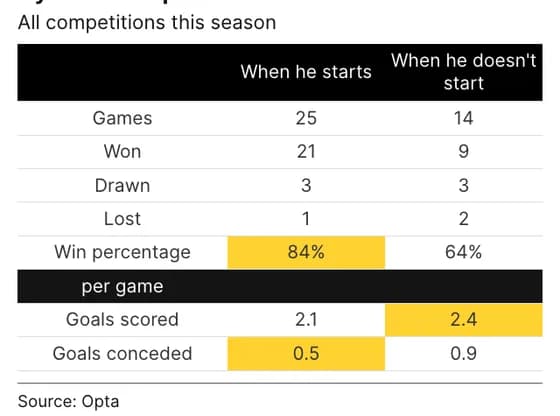 TableGyökeres' impact on Arsenal
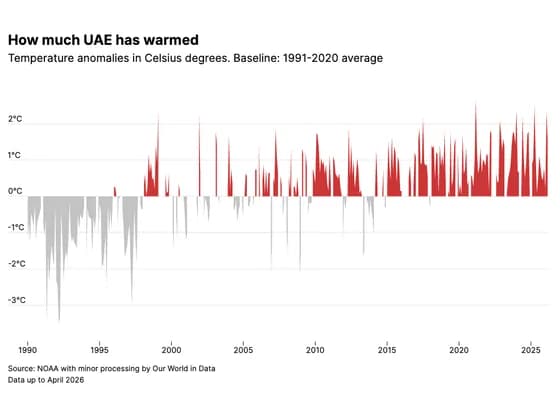 Line, bar and pie chartsHow much UAE has warmed
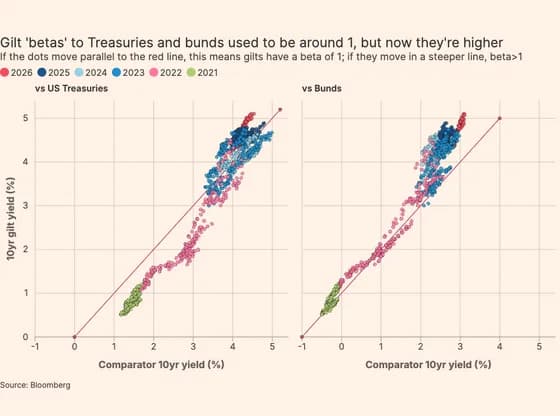 ScatterGilt 'betas' to Treasuries and bunds used to be around 1, but now they're higher
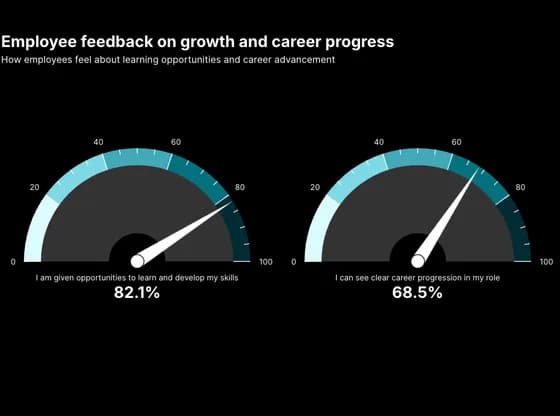 Counters and gaugesEmployee feedback on growth and career progress
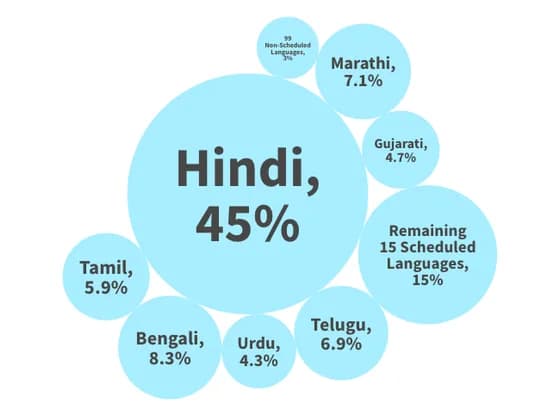 Distribution chartsIf Languages were States...
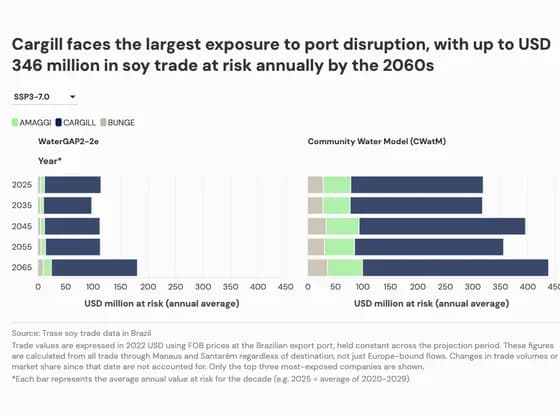 Line, bar and pie chartsCargill faces the largest exposure to port disruption, with up to USD 346 million in soy trade…
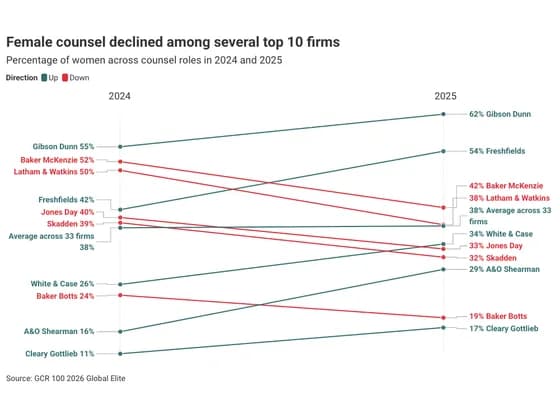 Slope chartFemale counsel declined among several top 10 firms
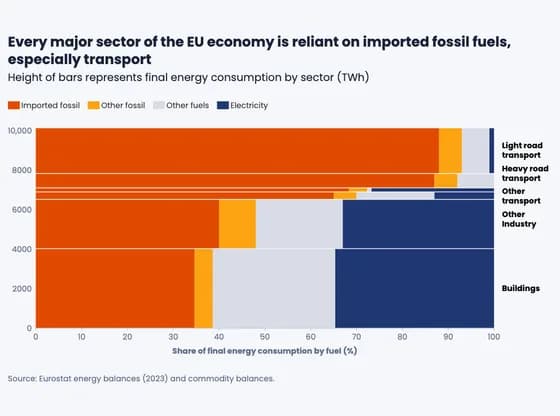 MarimekkoEvery major sector of the EU economy is reliant on imported fossil fuels, especially transport
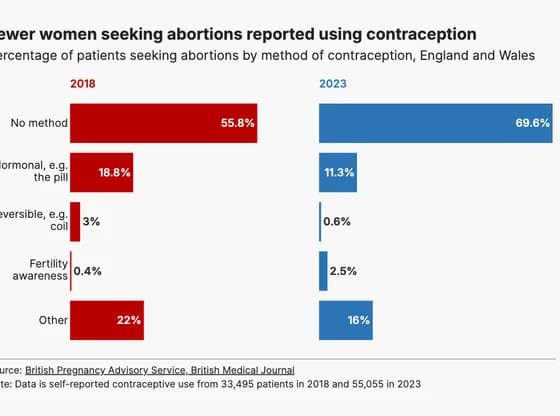 Line, bar and pie chartsFewer women seeking abortions reported using contraception
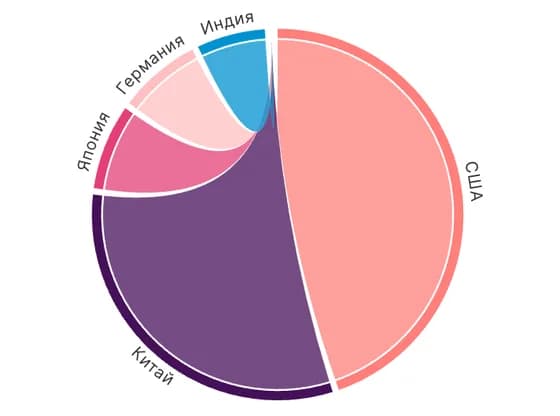 Network graphВВП по странам, млрд USD
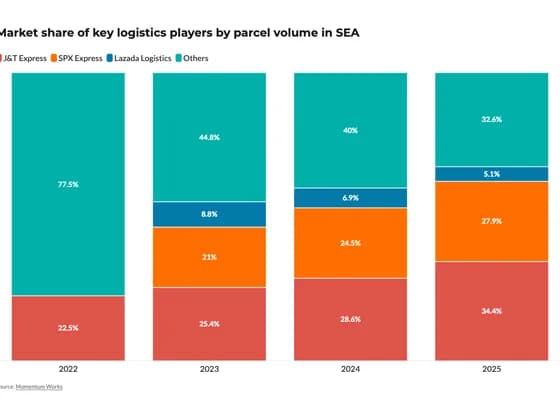 Line, bar and pie chartsMarket share of key logistics players by parcel volume in SEA
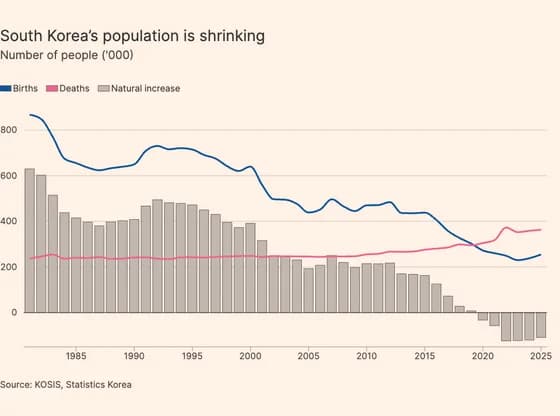 Line, bar and pie chartsSouth Korea’s population is shrinking
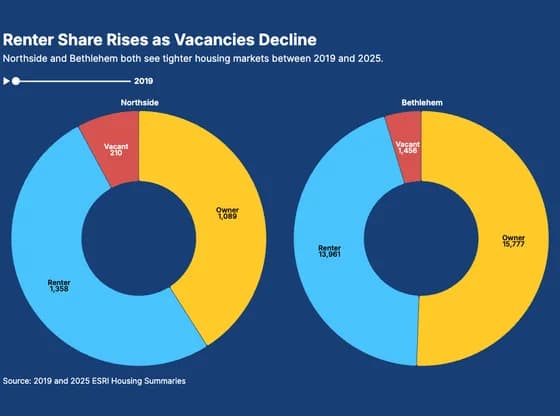 Line, bar and pie chartsRenter Share Rises as Vacancies Decline