A population pyramid is the standard chart for showing how a population splits by age and sex, and you can create one from a three-column table in a few minutes. This guide shows the data layout, the steps in the PlotSet editor, and how to read the result, using Italy's population on 1 January 2025 as the worked example.
What is a population pyramid?
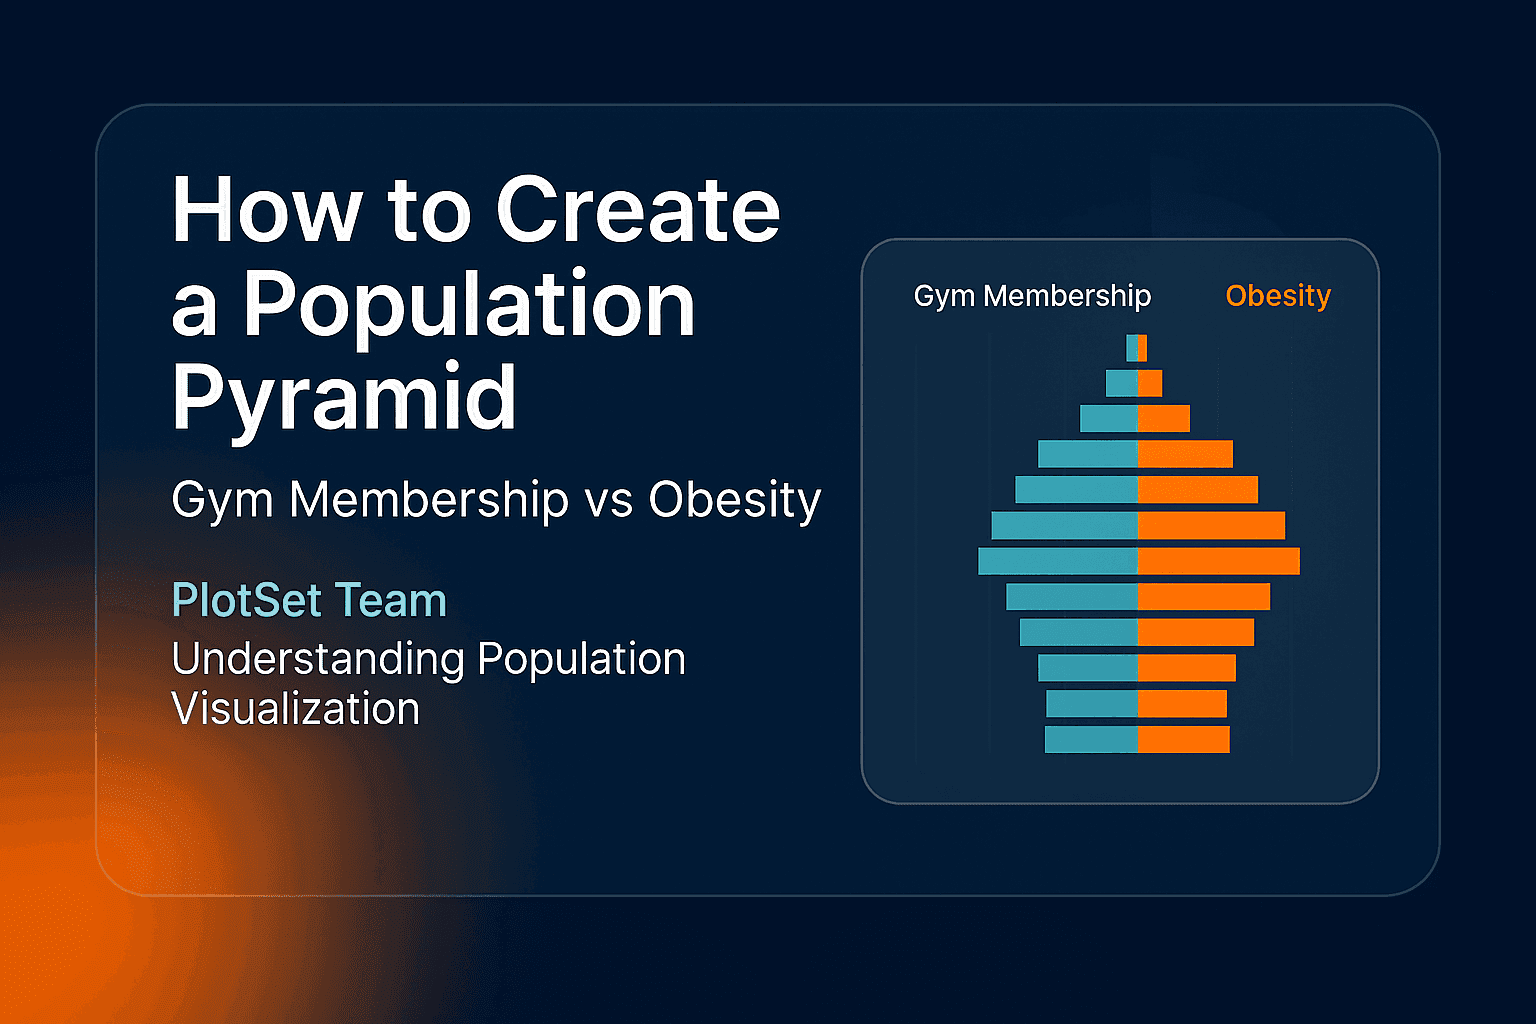
A population pyramid is a pair of horizontal bar charts placed back to back: men on one side, women on the other, with one bar per age group stacked from the youngest at the bottom to the oldest at the top. The outline shows a population's age structure at a glance.
A wide base means many children, and a narrow base with a wide middle means an ageing population. The name comes from the shape that countries with high birth rates produce: wide at the bottom, narrowing to a point. Many rich countries no longer look like that. Their pyramids are closer to a column, or bulge in the middle where the baby-boom generations sit.
A live example: Italy in 2025
Italy is one of the oldest populations in the world, and its pyramid shows why. The chart below uses Eurostat's count of residents on 1 January 2025, in five-year age groups.
Three things stand out:
- The widest bars are in the middle. The largest age group is 55 to 59, with 4.83 million people, 2.4 times the 1.98 million children under five. These are the people born in Italy's high-birth years of the 1960s.
- The base keeps shrinking. Every five-year group below 45 is smaller than the one above it, all the way down. That is a pyramid standing on its tip: fewer births each decade.
- The top leans to the right. Among people aged 85 and over there are 1.56 million women and 0.85 million men, about 1.8 women for every man, because women live longer.
In total, 24.7% of Italy's 58.9 million residents were 65 or older and 11.9% were under 15. Eurostat's population structure and ageing overview puts these figures in the context of the rest of the EU.
How to create a population pyramid
1. Get counts by age group and sex
You need one number per age group for each sex. National statistics offices publish these, and for Europe the Eurostat table demo_pjangroup gives five-year groups for every member state. Census bureaus elsewhere publish the same breakdown.
Use counts or percentages of the total, but not a mix. Percentages are better when you want to compare two countries of different size.
2. Lay the table out in three columns
One row per age group, the label in the first column, men in the second and women in the third:
| Age | Men | Women |
|---|---|---|
| 85+ | 0.85 | 1.56 |
| 80–84 | 0.92 | 1.25 |
| … | … | … |
| 0–4 | 1.02 | 0.96 |
Put the oldest group in the first row. The chart draws the rows from top to bottom in the order you give them, so this order puts the children at the base. Enter both columns as positive numbers: the template mirrors the first value column to the left side for you.
3. Open the template and add the data
In the PlotSet dashboard, create a new chart and search the template list for "Population Pyramid". Then add your table in one of three ways: upload a CSV (Excel can save one), paste it straight from a spreadsheet, or connect a Google Sheet by its URL. The three ways to insert data post covers each in more detail.
4. Check the binding
In the data panel, bind Labels to the age column and Values to the two columns with the counts (B to C in the example). The optional Images slot can stay empty. If a side of the pyramid is missing, the values range does not cover both columns.
5. Set the few settings that matter
- Colours: pick two clearly different colours for the two sides and keep them consistent if you make several pyramids.
- Number format: the example uses two decimals with an "M" suffix, so 2.37 reads as 2.37 million.
- Bar values: turn them on when there are fewer than about 20 bars. More than that and the labels crowd.
- Title and subtitle: say the place, the date and the unit, and use the subtitle for the one thing readers should notice.
- Source: name the statistics office and the table in the footer.
6. Publish, embed or export
Publish to get a live interactive chart with an embed code for any website, or export it as a PNG, SVG or JPG for a report or slide. The population pyramid guide walks through the editor with the same steps.
How to read a population pyramid
Read it from the outline first, then from single bars:
| Shape | What it usually means |
|---|---|
| Wide base, narrow top | High birth rates and shorter lives (a growing population) |
| Straight sides, like a column | Births roughly steady for decades |
| Narrow base, wide middle | Falling births and an ageing population, as in Italy |
| A dent at one age | A war, an epidemic or a sharp fall in births in the years that group was born |
| One side much longer at the top | Women outliving men, or a large gap in migration by sex |
When to use a different chart
A pyramid shows one population at one moment. To compare two countries, plot both as percentages on the same scale, or switch to a grouped bar chart of selected age groups. To show how a single figure such as the share of people over 65 changed over the years, a line chart is clearer. For a quick split of a few broad age bands, a stacked bar chart is enough. The population pyramid maker page has more on when the chart fits.
FAQ
What data do I need to create a population pyramid?
Counts or percentages of a population by age group, split by sex. Five-year age groups are the usual choice, published by national statistics offices and by Eurostat for EU countries.
Why is it called a population pyramid?
Because populations with high birth rates have many more young people than old ones, so the chart is wide at the bottom and narrow at the top. Many countries today have a different shape, but the name stuck.
Should I use numbers or percentages?
Use numbers for one population on its own. Use percentages of the total when you compare two populations of different size, so the shapes are comparable.
Can I make a population pyramid in Excel?
Yes, with a bar chart and negative values for one sex, but the axis then shows negative numbers that need custom formatting. In PlotSet you enter both columns as positive numbers and the template mirrors one side for you.
How do I compare two population pyramids?
Use the same age groups, the same unit (percentages are best) and the same axis range for both, and place them side by side. Differences in shape are then real, not an effect of scale.