
Data visualization is necessary when comprehending data. Just like that, choosing the right colors is necessary for data visualization. As a result, it is important to know the basic rules for choosing colors for your designs.
In the following blog, you will read about the 6 core principles of using color in data visualization.
1. Use intuitive colors
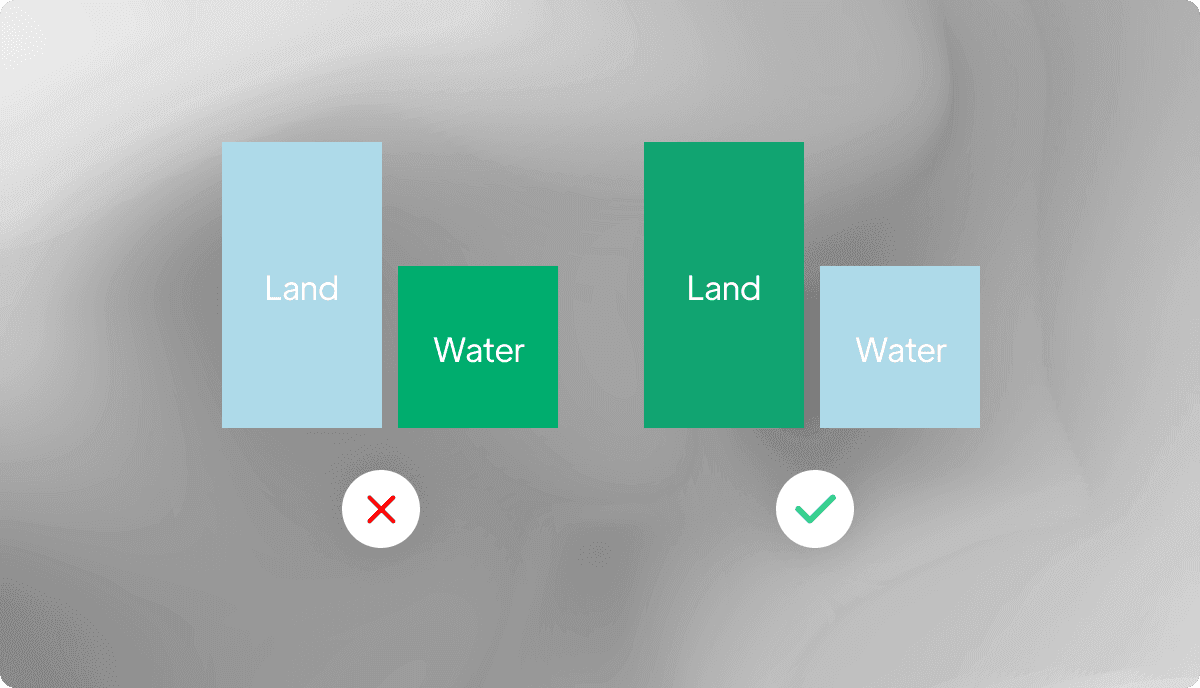
When choosing colors for your data, it's important to consider the association they evoke in the mind of the viewers. For instance, choose brown if you want to display data about coffee or green if you wish to represent data about lands. By using colors in a way that makes sense, the viewer can identify patterns, trends, and relationships quickly.
2. Use distinguishable colors

The viewers should be able to tell the difference between different data points quickly by looking at the colors. Therefore, you need to choose colors that are easy to distinguish.
3. Use colors in moderation

Excessive use of colors can lead to confusion. Remember that we want to use colors to make the data easier to comprehend. We don't want to create a Picasso painting! For example, if you have a single dataset, one color will suffice to display. So, keep your eyes on the goal and choose colors strategically.
4. Use color palettes to display classification

You should use the same color for the same measurement to display categories and classifications. Using gradient colors is not suitable for this purpose.
5. Use colors consistently
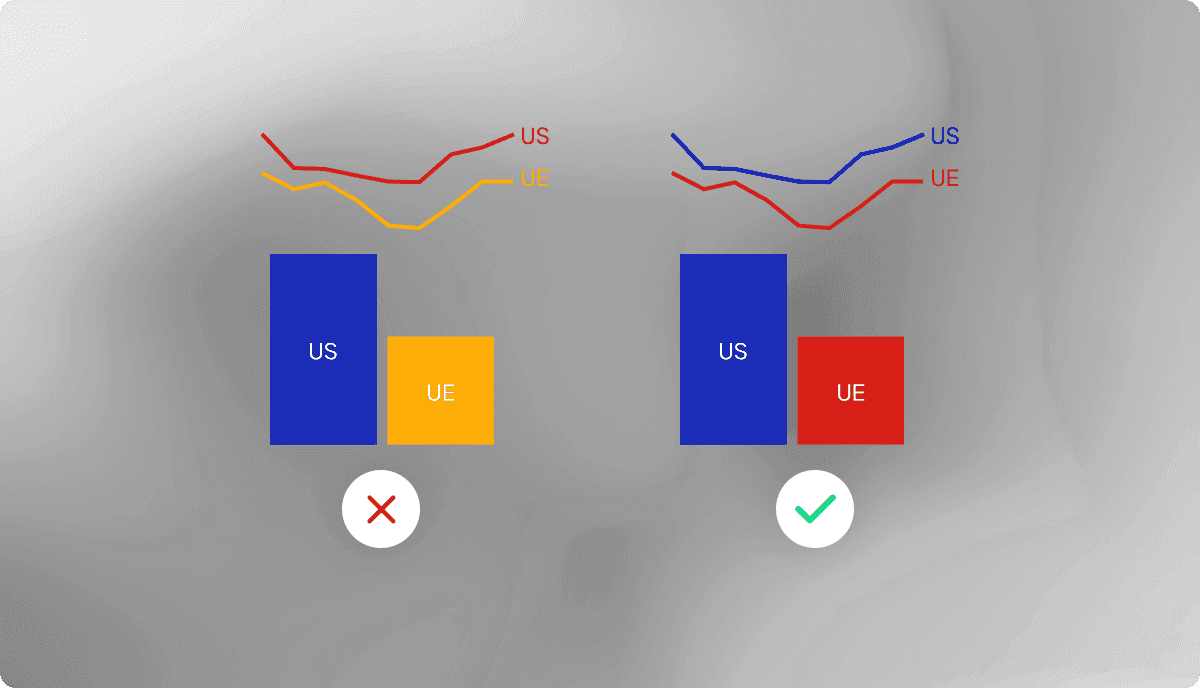
You can change the colors anytime you want. However, make sure that the colors match your data points. Consistency in colors helps the viewers to follow the data points easier.
6. Always explain the colors
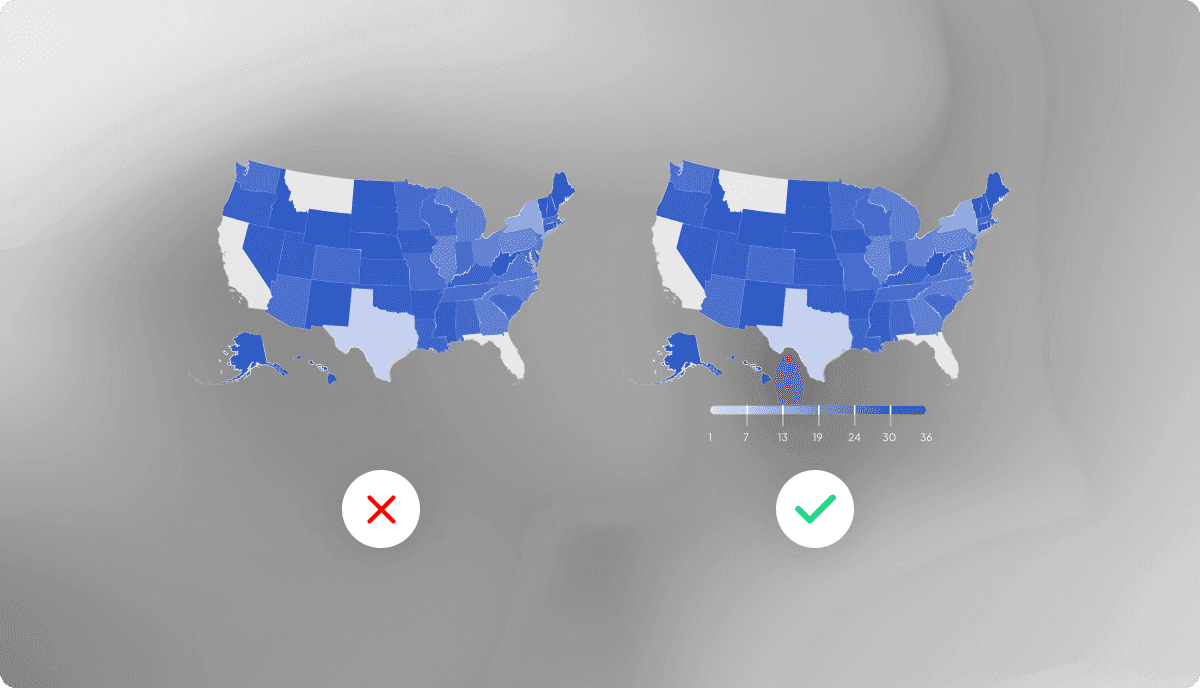
Your viewers are not mind readers. Hence, you need to explain what the colors you use represent. Use legends as the color key to explain them.
Colors can be your best allies in creating data visualizations. Choose them wisely.
It would help a lot if you learn How to Apply Color to Data Visualizations.


