
这里的每张图表,最初都是一张表格。
地图、柱状图竞赛、矩形树图、象形图等。打开任意一张,换上你自己的数据。
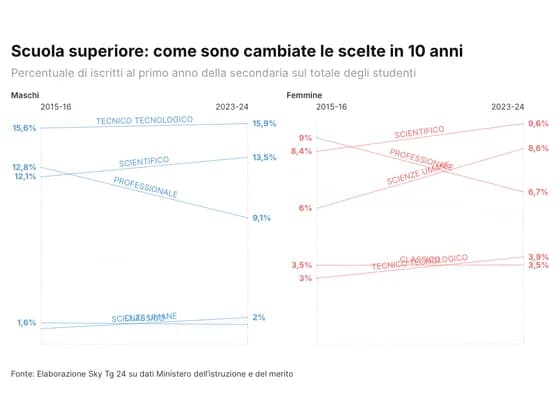 Slope chartScuola superiore: come sono cambiate le scelte in 10 anni
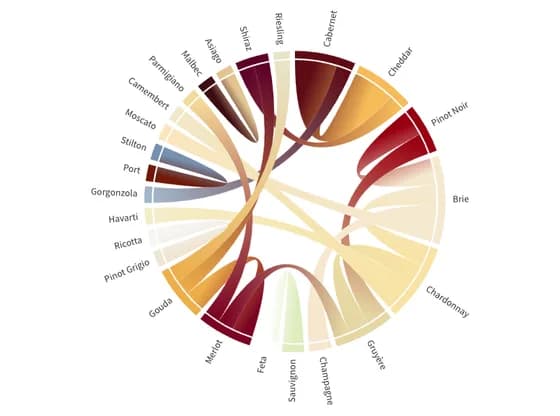 Network graphWine & Cheese pairings
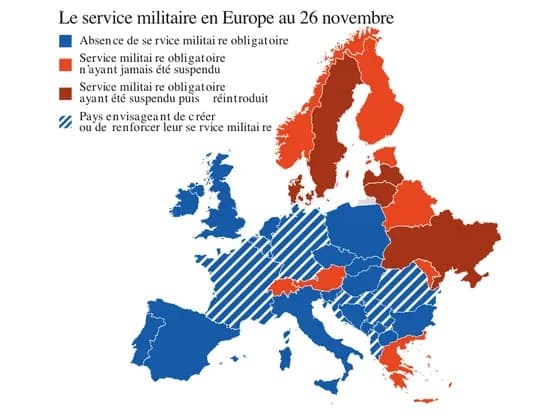 Interactive SVGCarte Service militaire Europe
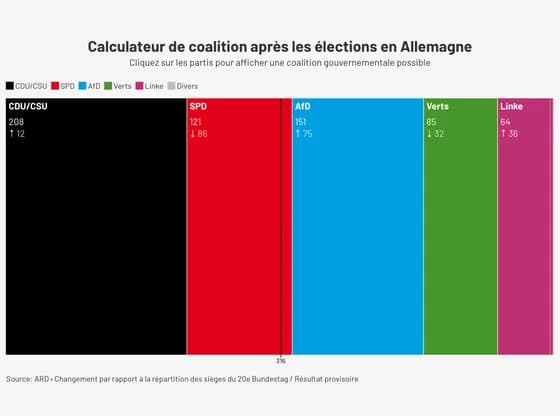 Elections and parliamentsCalculateur de coalition après les élections en Allemagne
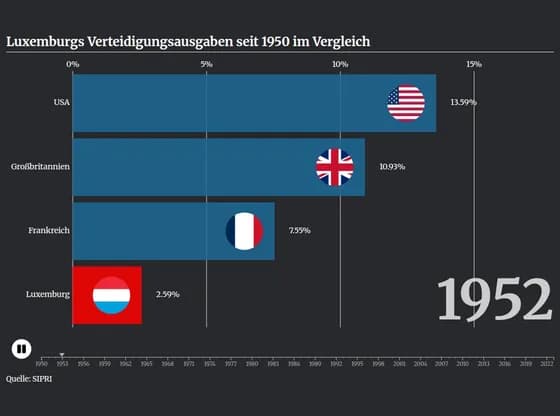 Animated chartsLuxemburgs Verteidigungsausgaben seit 1950 im Vergleich
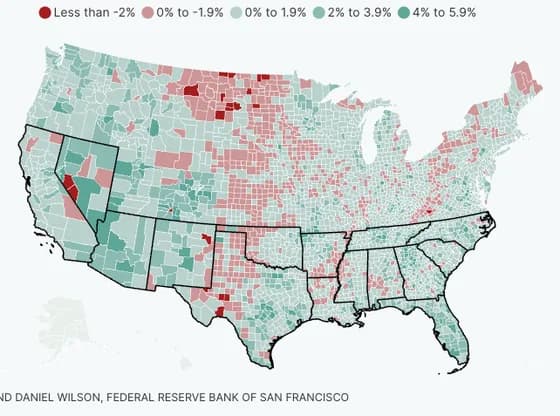 MapsSUN BELT MIGRATION SLOWING
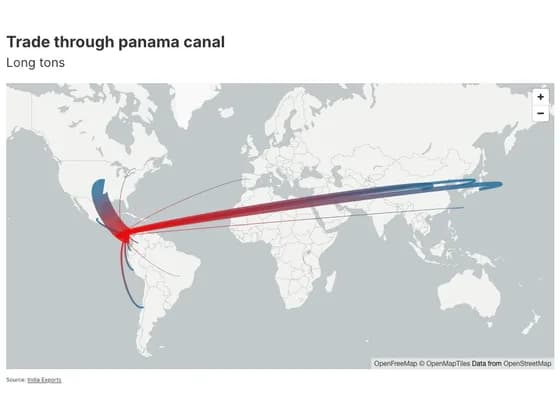 3D mapTrade through panama canal
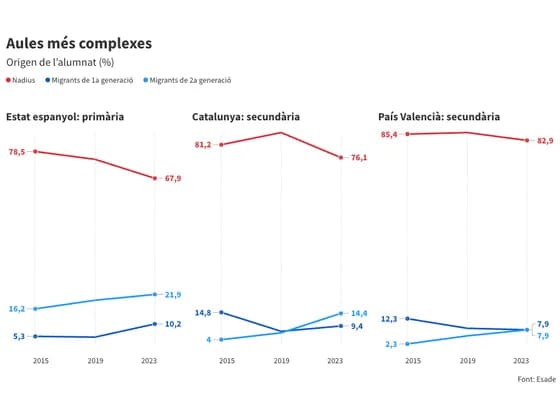 Slope chartAules més complexes
 Interactive toolsThe bread supply chain, from mills to bakeries
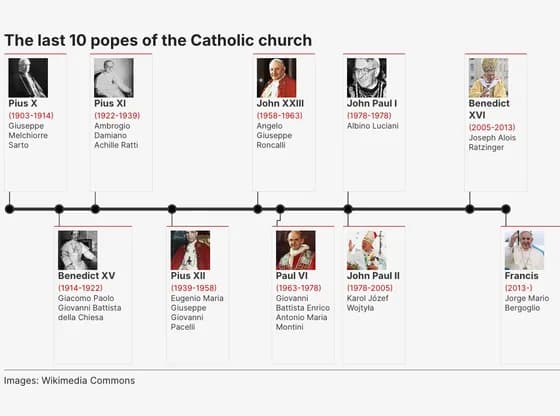 TimelineThe last 10 popes of the Catholic church
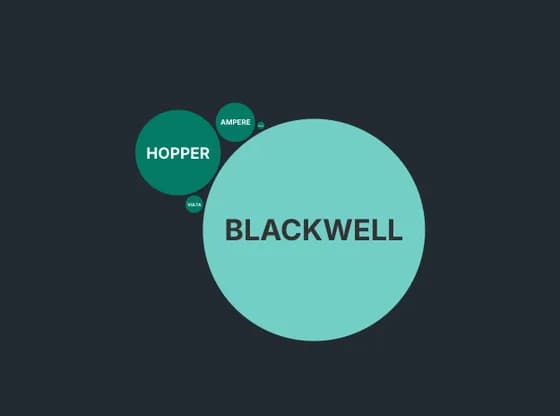 Distribution chartsNVIDIA'S AI CHIPS KEEP GETTING MORE POWERFUL
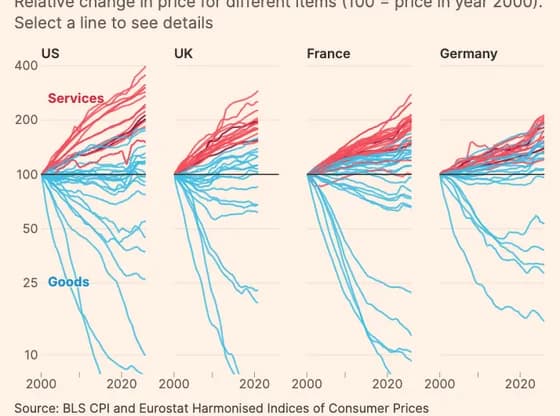 Line, bar and pie chartsCosts of labour-intensive services have soared in high-income countries, while tradable goods…
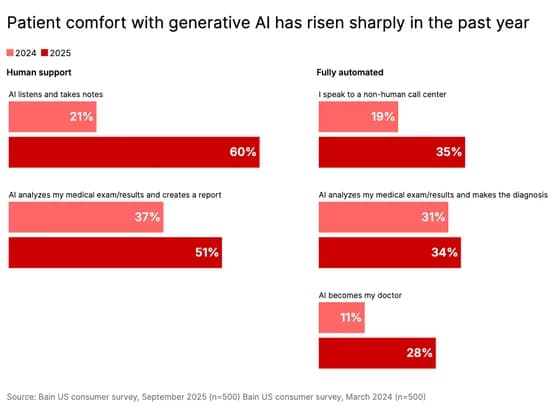 Line, bar and pie chartsPatient comfort with generative AI has risen sharply in the past year
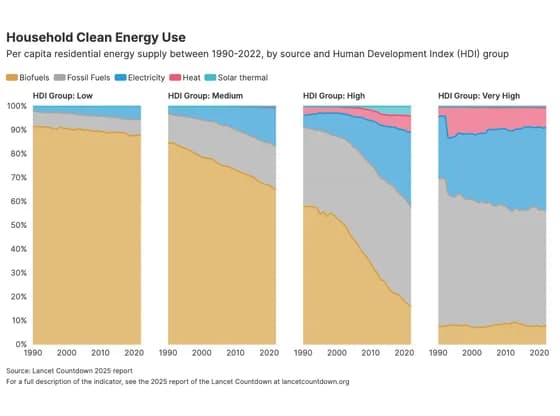 Line, bar and pie chartsHousehold Clean Energy Use
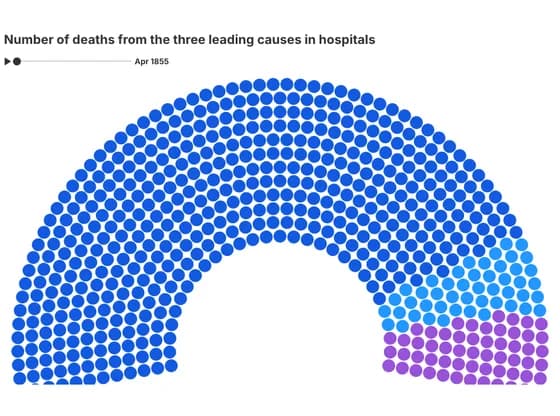 Elections and parliamentsNumber of deaths from the three leading causes in hospitals
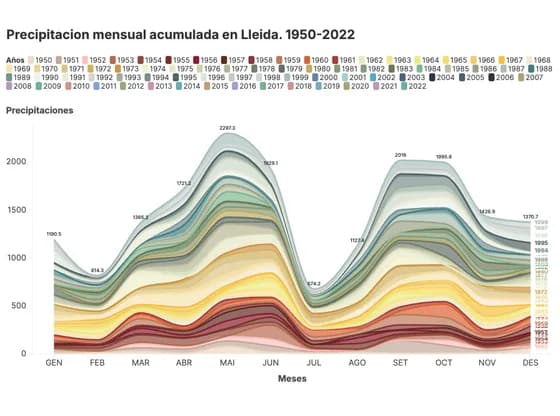 Line, bar and pie chartsPrecipitacion mensual acumulada en Lleida. 1950-2022
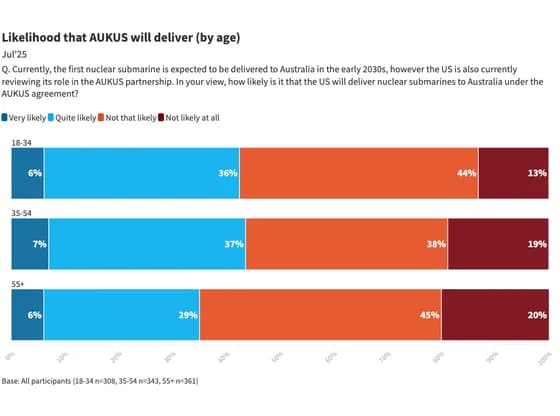 Line, bar and pie chartsLikelihood that AUKUS will deliver (by age)
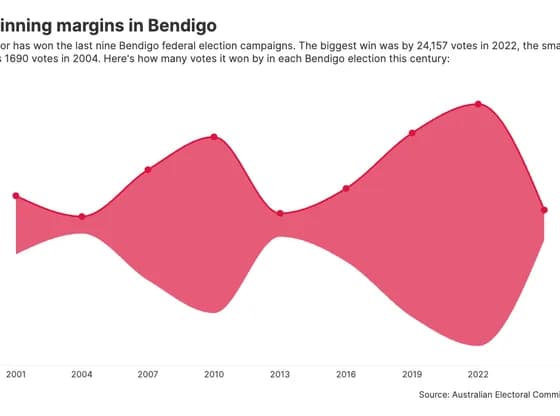 Line, bar and pie chartsWinning margins in Bendigo
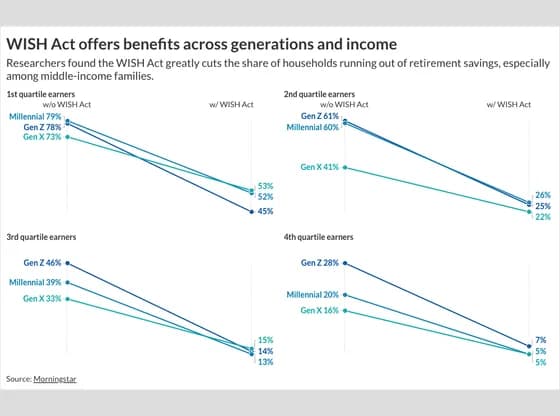 Slope chartWISH Act offers benefits across generations and income
 3D globeEntwicklung der CO2-Emissionen von 1960 bis 2023