
这里的每张图表,最初都是一张表格。
地图、柱状图竞赛、矩形树图、象形图等。打开任意一张,换上你自己的数据。
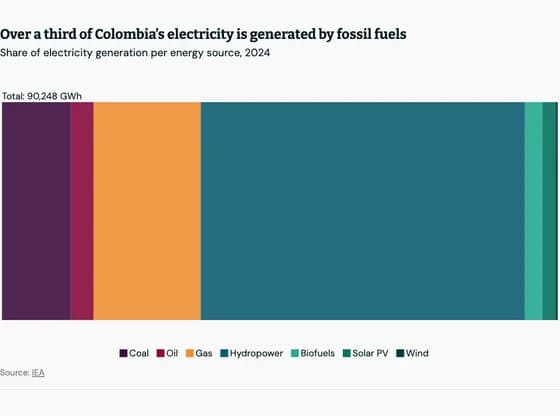 Line, bar and pie chartsOver a third of Colombia’s electricity is generated by fossil fuels
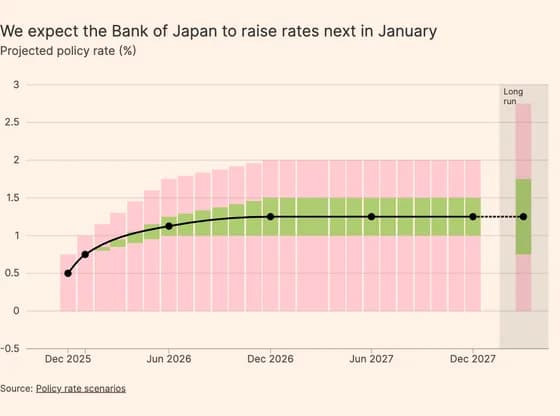 Line, bar and pie chartsWe expect the Bank of Japan to raise rates next in January
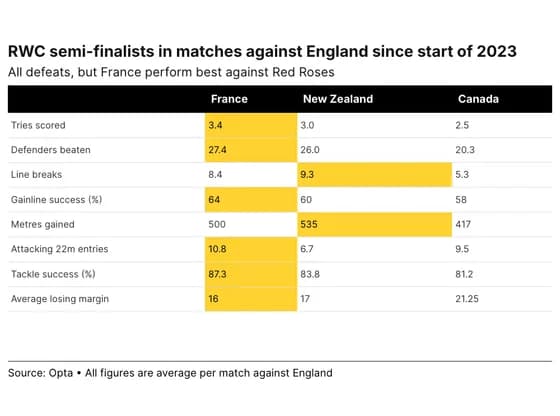 TableRWC semi-finalists in matches against England since start of 2023
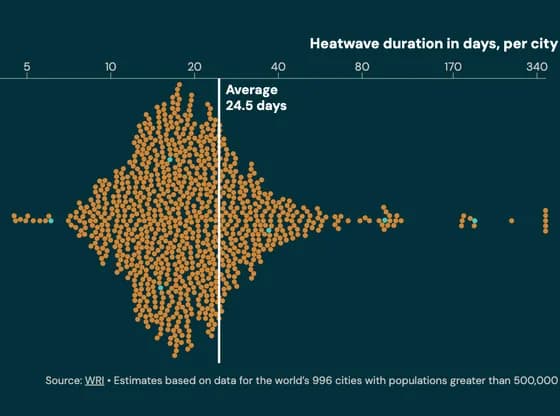 ScatterHeatwave duration in days, per city
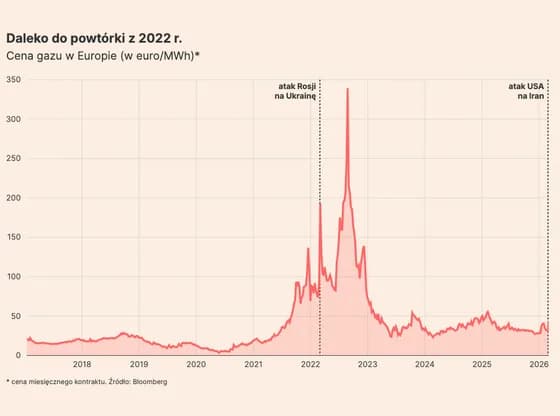 Line, bar and pie chartsDaleko do powtórki z 2022 r.
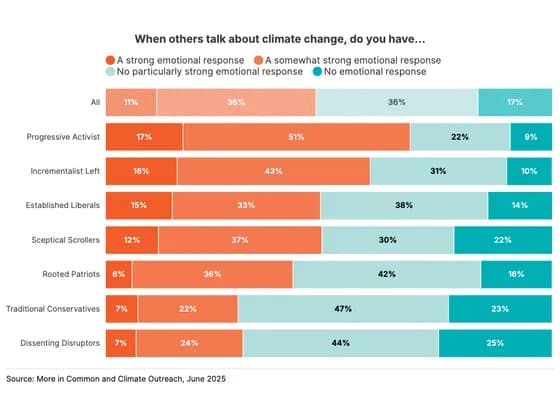 Line, bar and pie chartsWhen others talk about climate change, do you have...
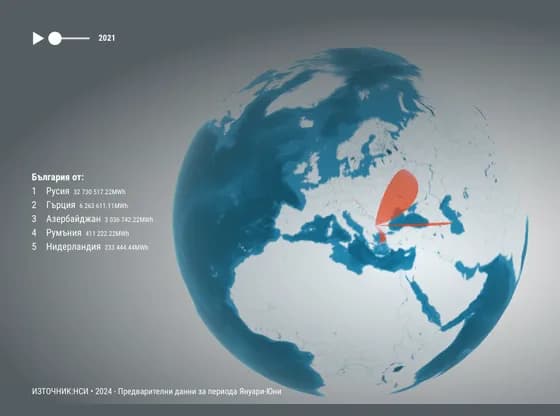 Connections and flow mapsCopy of Copy of Внос на природен газ по страна-партньор
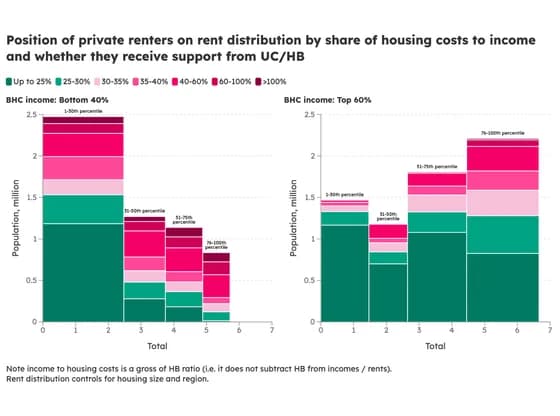 MarimekkoPosition of private renters on rent distribution by share of housing costs to income and whether…
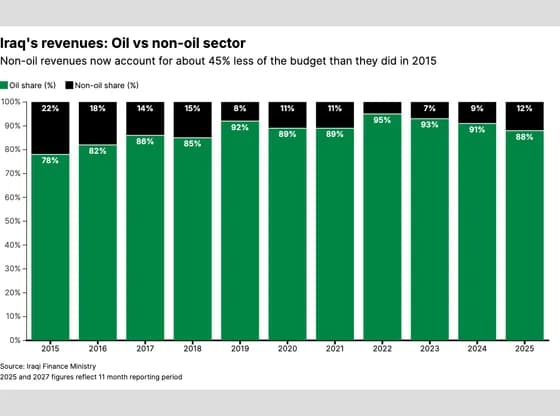 Line, bar and pie chartsIraq's revenues: Oil vs non-oil sector
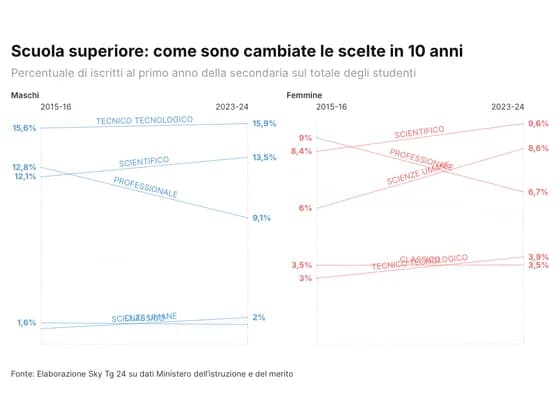 Slope chartScuola superiore: come sono cambiate le scelte in 10 anni
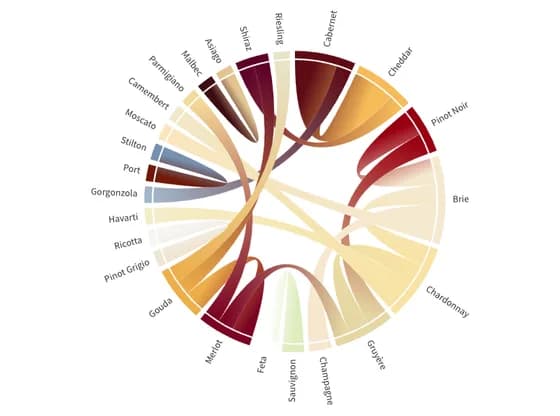 Network graphWine & Cheese pairings
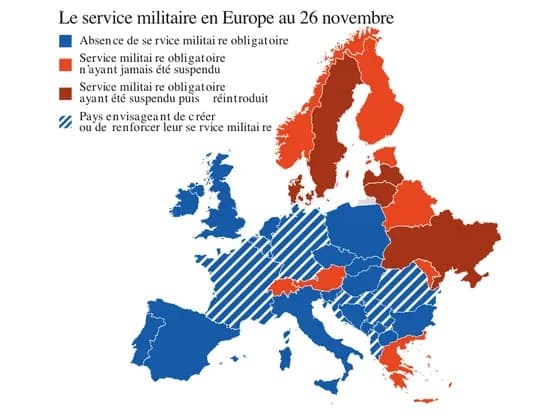 Interactive SVGCarte Service militaire Europe
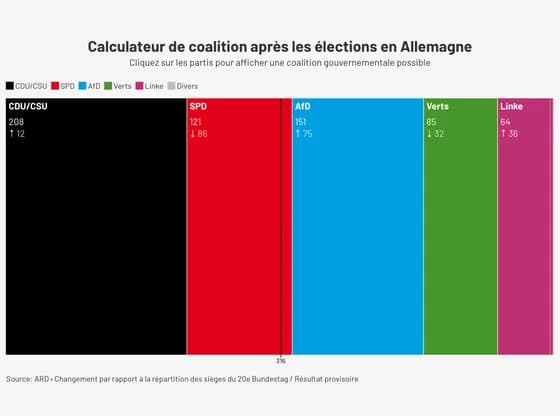 Elections and parliamentsCalculateur de coalition après les élections en Allemagne
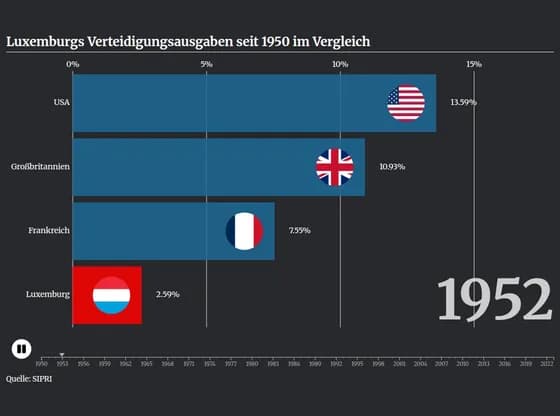 Animated chartsLuxemburgs Verteidigungsausgaben seit 1950 im Vergleich
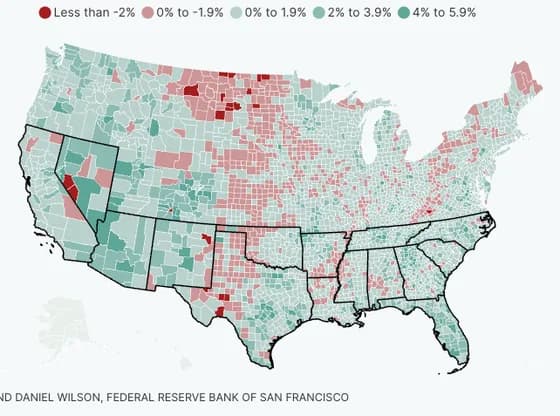 MapsSUN BELT MIGRATION SLOWING
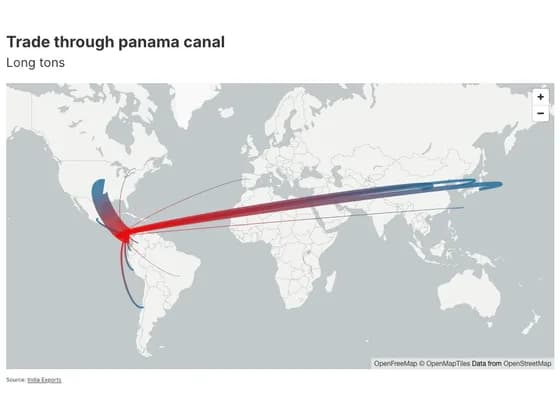 3D mapTrade through panama canal
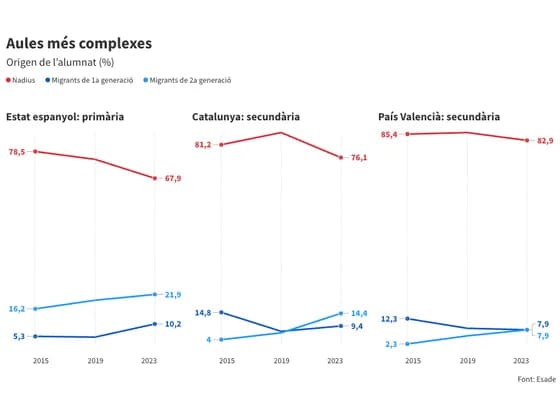 Slope chartAules més complexes
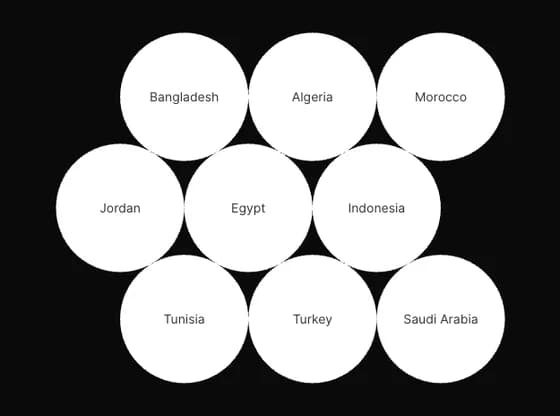 Interactive toolsThe bread supply chain, from mills to bakeries
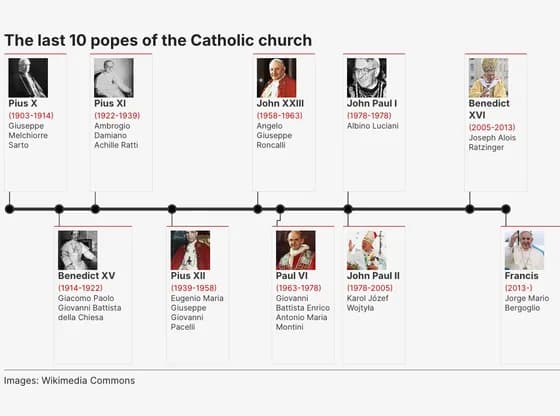 TimelineThe last 10 popes of the Catholic church
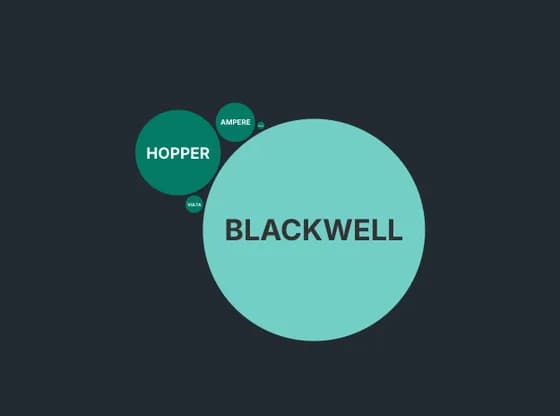 Distribution chartsNVIDIA'S AI CHIPS KEEP GETTING MORE POWERFUL