
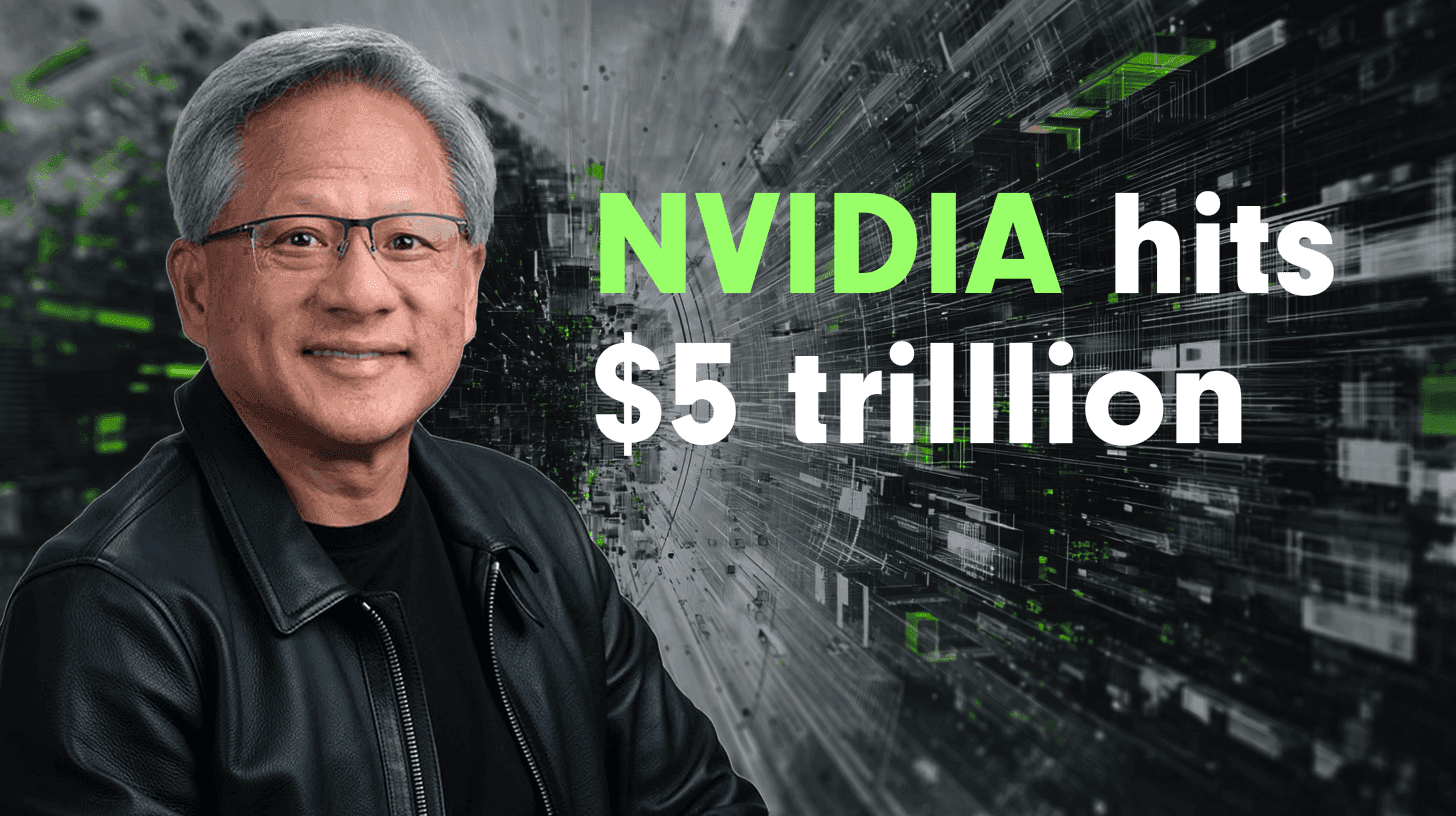
Nvidia hit $5 trillion in market value today.
It's the first company in history to do that. In fact, it added about $300 billion in a day. What happened? Let dig a little.
阅读约 6 分钟
It's the first company in history to do that. In fact, it added about $300 billion in a day. What happened? Let dig a little.
阅读约 6 分钟
You know those viral videos where lines race across the screen, competing for the top spot while the numbers tick up dramatically? The ones that get millions of views on LinkedIn.
阅读约 6 分钟
Most charts are ugly. You know it. I know it. That boring blue bar chart in every presentation? The pie chart that makes people’s eyes glaze over?
阅读约 5 分钟
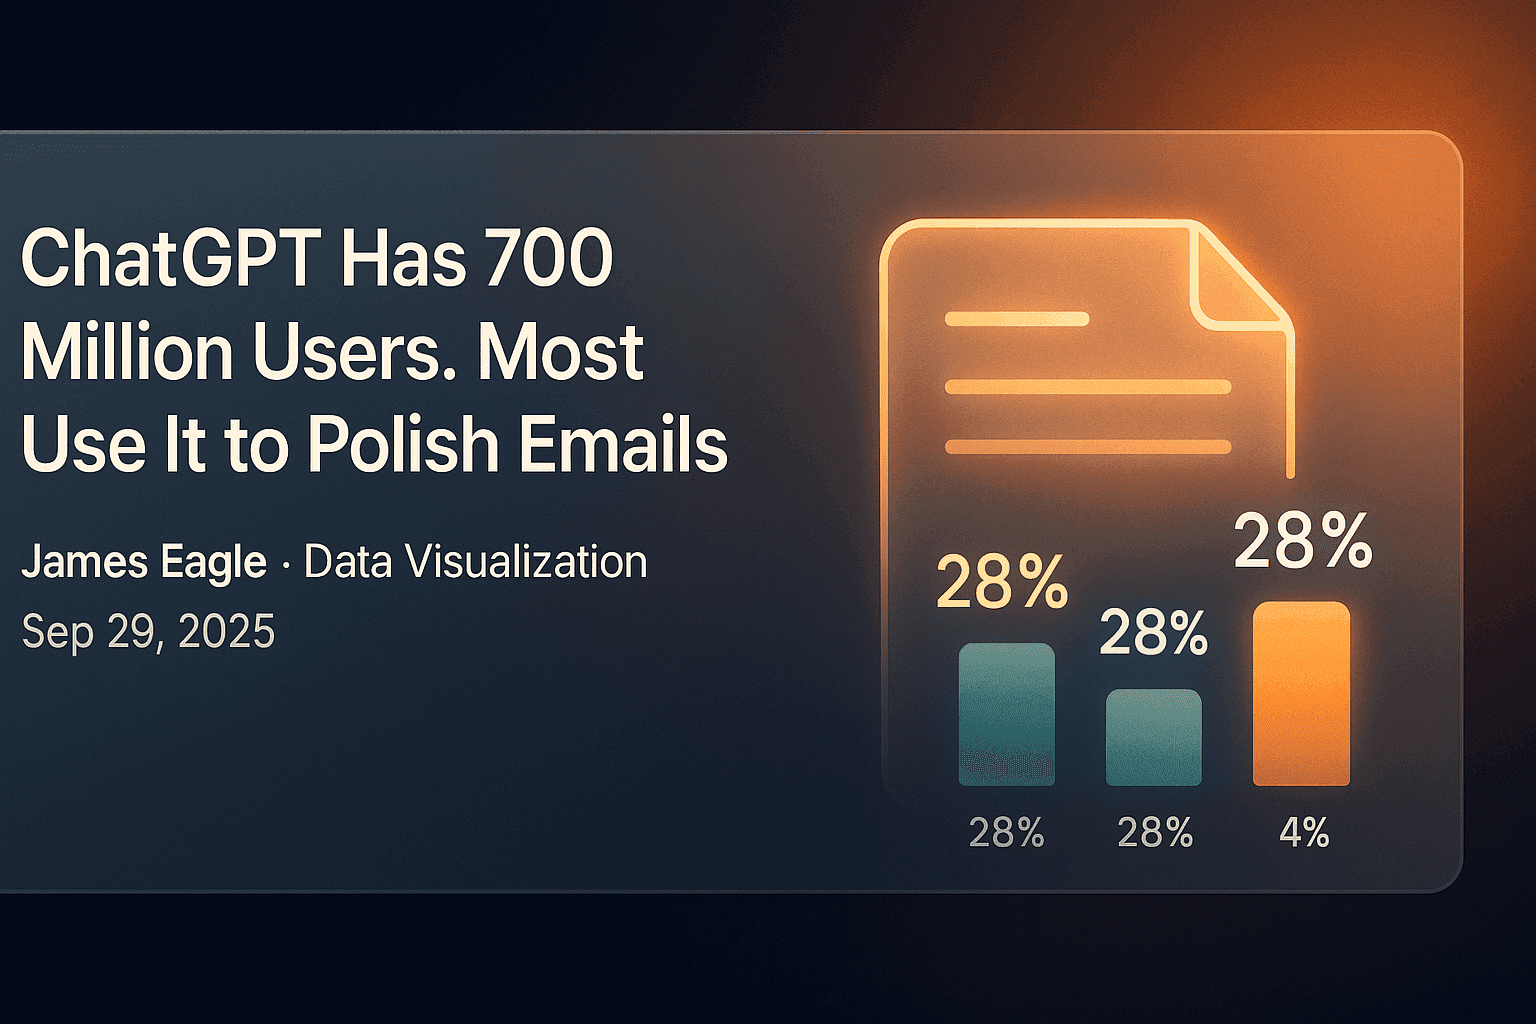
An NBER study of how people use ChatGPT: 73% of messages are not work, writing fell from 36% to 24% of use, and only 4.2% is coding. See the chart.
阅读约 6 分钟
The chart that took me from unknown to viral is now available to everyone. No code required.
阅读约 4 分钟
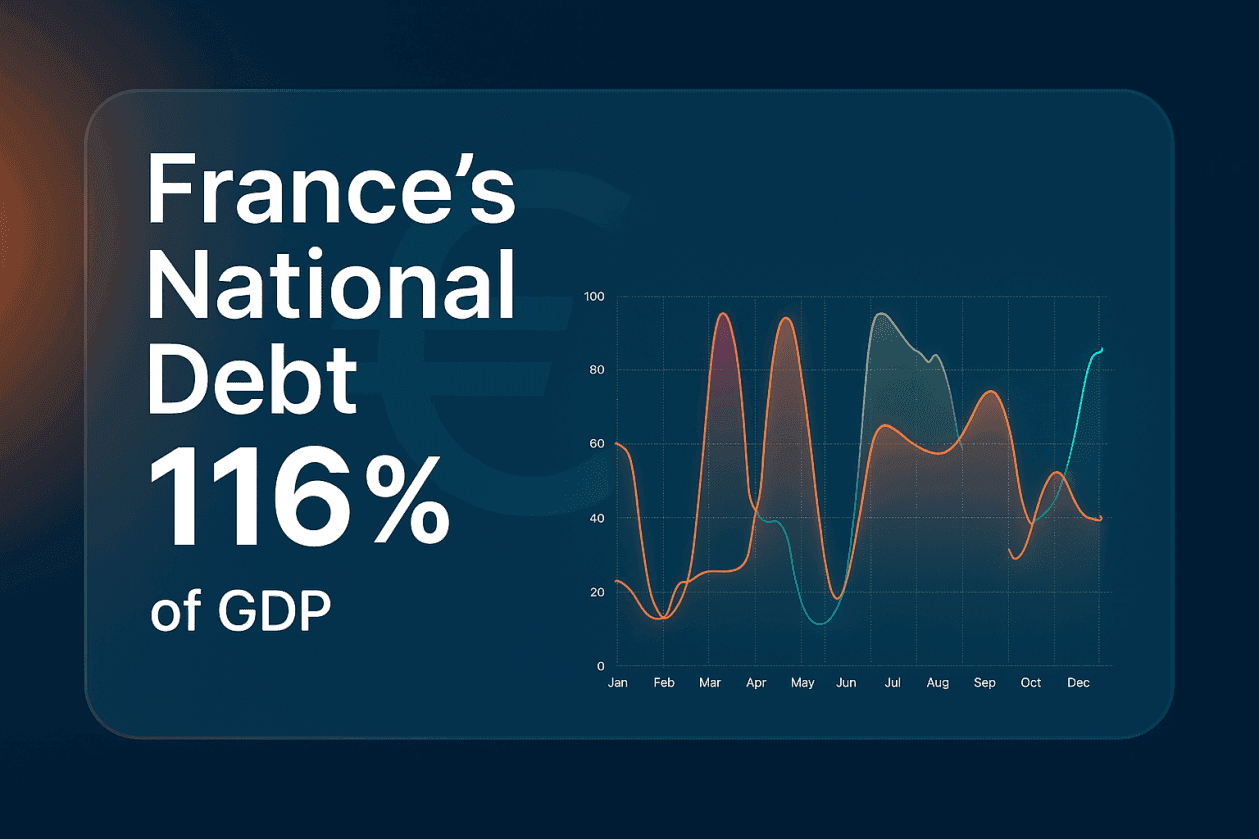
France’s debt burden has reached breaking point. Debt now stands at 116 per cent of GDP, while Germany sits at just under 64 per cent.
阅读约 2 分钟
In my first newsletter, I'm defending the humble bar chart whilst admitting why I can't beat it.
阅读约 3 分钟
Ten tested prompts for AI-generated charts with the PlotSet MCP server in Claude, ChatGPT or Cursor: what to write, what the agent does, and how to check it.
阅读约 7 分钟

Finding the perfect dataset for a compelling chart or visualization can often feel like looking for a needle in a haystack.
阅读约 3 分钟
Colors are more than aesthetic choices; they are strategic tools in data visualization. They guide attention, communicate meaning, and evoke emotions.
阅读约 3 分钟
How to pick a colorblind-friendly palette for charts: which colors clash, the Okabe-Ito palette, contrast targets, shapes and labels, and how to test.
阅读约 7 分钟
Learn how features like SVG export help you create sharp, scalable charts that fit perfectly into your designs. Say goodbye to blurry images and complicated workflows!
阅读约 4 分钟