
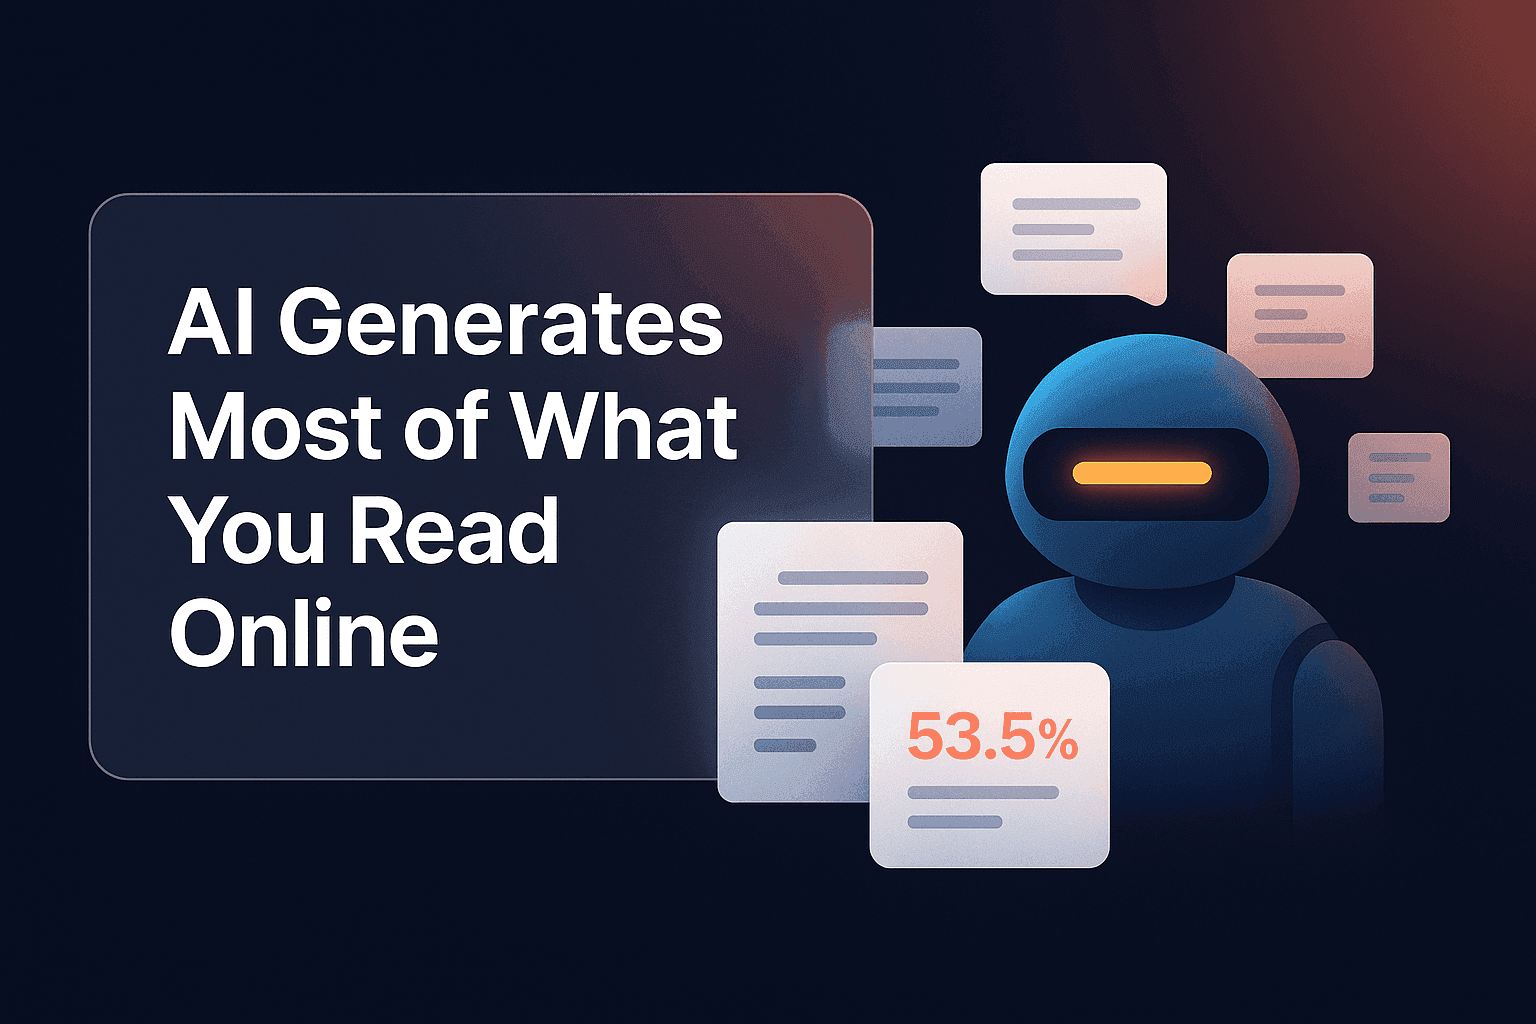
AI-Generated Content: Half of New Web Articles in 2025
Graphite's study found AI-written articles rose from 2% of new web articles in 2020 to about half by 2025. See the monthly chart, the method and its limits.
阅读约 6 分钟
Graphite's study found AI-written articles rose from 2% of new web articles in 2020 to about half by 2025. See the monthly chart, the method and its limits.
阅读约 6 分钟

The chart that took me from unknown to viral is now available to everyone. No code required.
阅读约 4 分钟
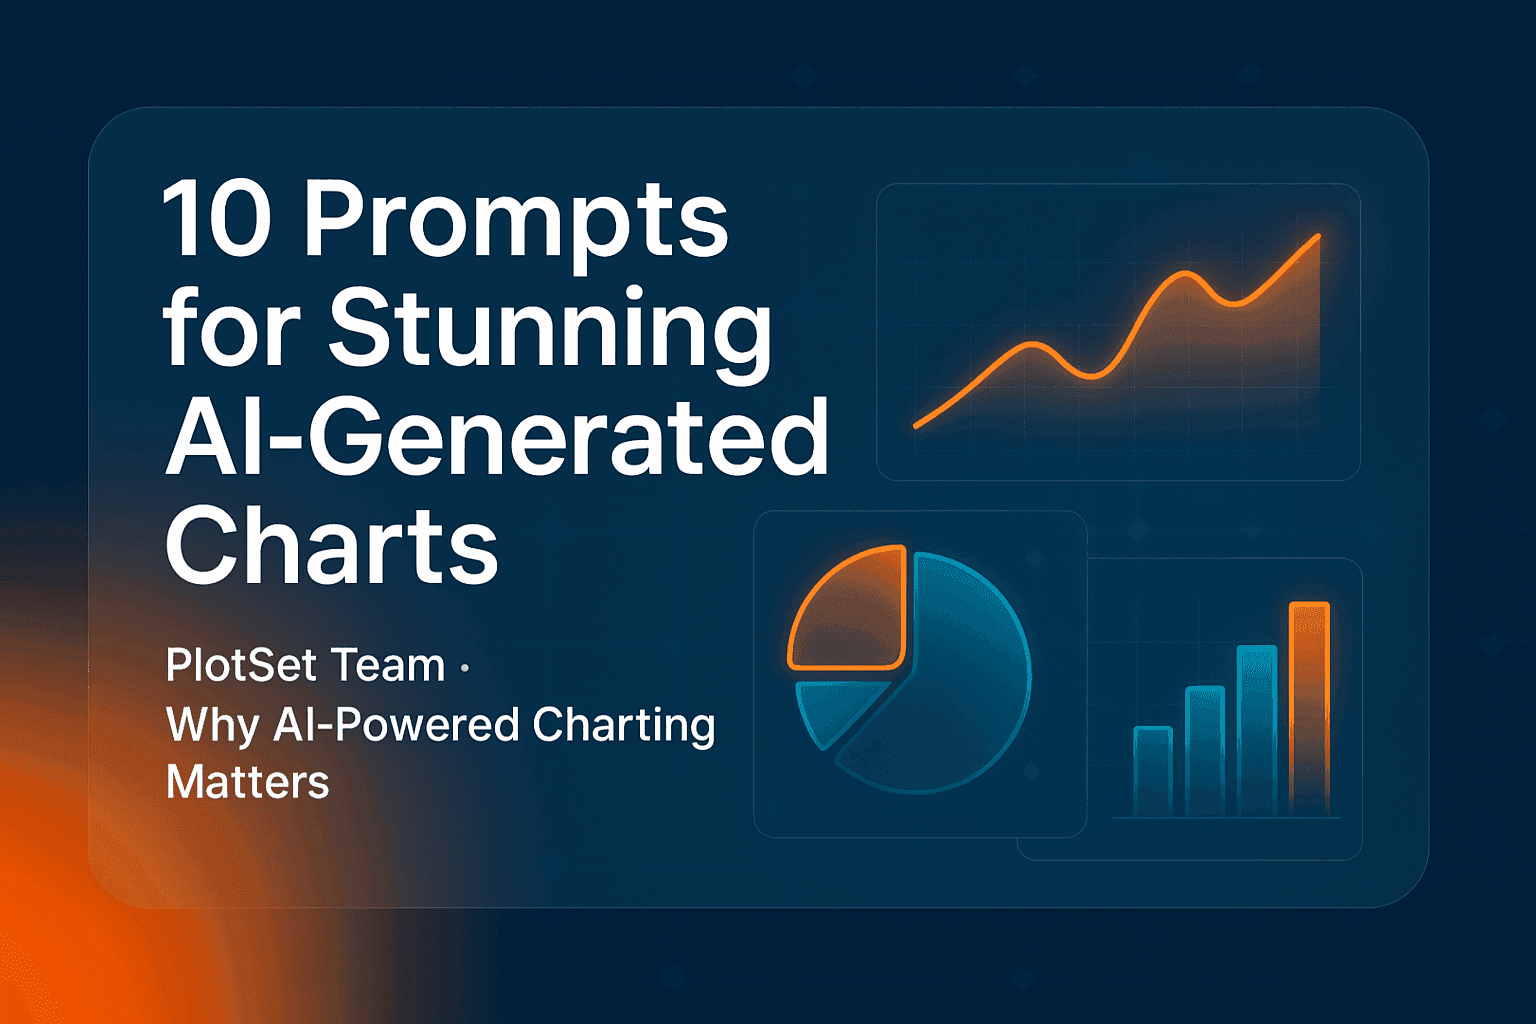
Ten tested prompts for AI-generated charts with the PlotSet MCP server in Claude, ChatGPT or Cursor: what to write, what the agent does, and how to check it.
阅读约 7 分钟

Finding the perfect dataset for a compelling chart or visualization can often feel like looking for a needle in a haystack.
阅读约 3 分钟

Learn how features like SVG export help you create sharp, scalable charts that fit perfectly into your designs. Say goodbye to blurry images and complicated workflows!
阅读约 4 分钟

How AI and data visualization work together today: where AI helps (cleaning, chart choice, building through MCP), where it fails, and how to check its charts.
阅读约 6 分钟

Find out how to set up the 'Pie' Settings in Pie Charts and Donut Charts.
阅读约 3 分钟

Discover the process of forking a shared chart with our comprehensive guide.
阅读约 2 分钟

Discover the intricacies of designing a Column Chart with the help of the Columns Settings. Enhance your data visualization skills today.
阅读约 3 分钟
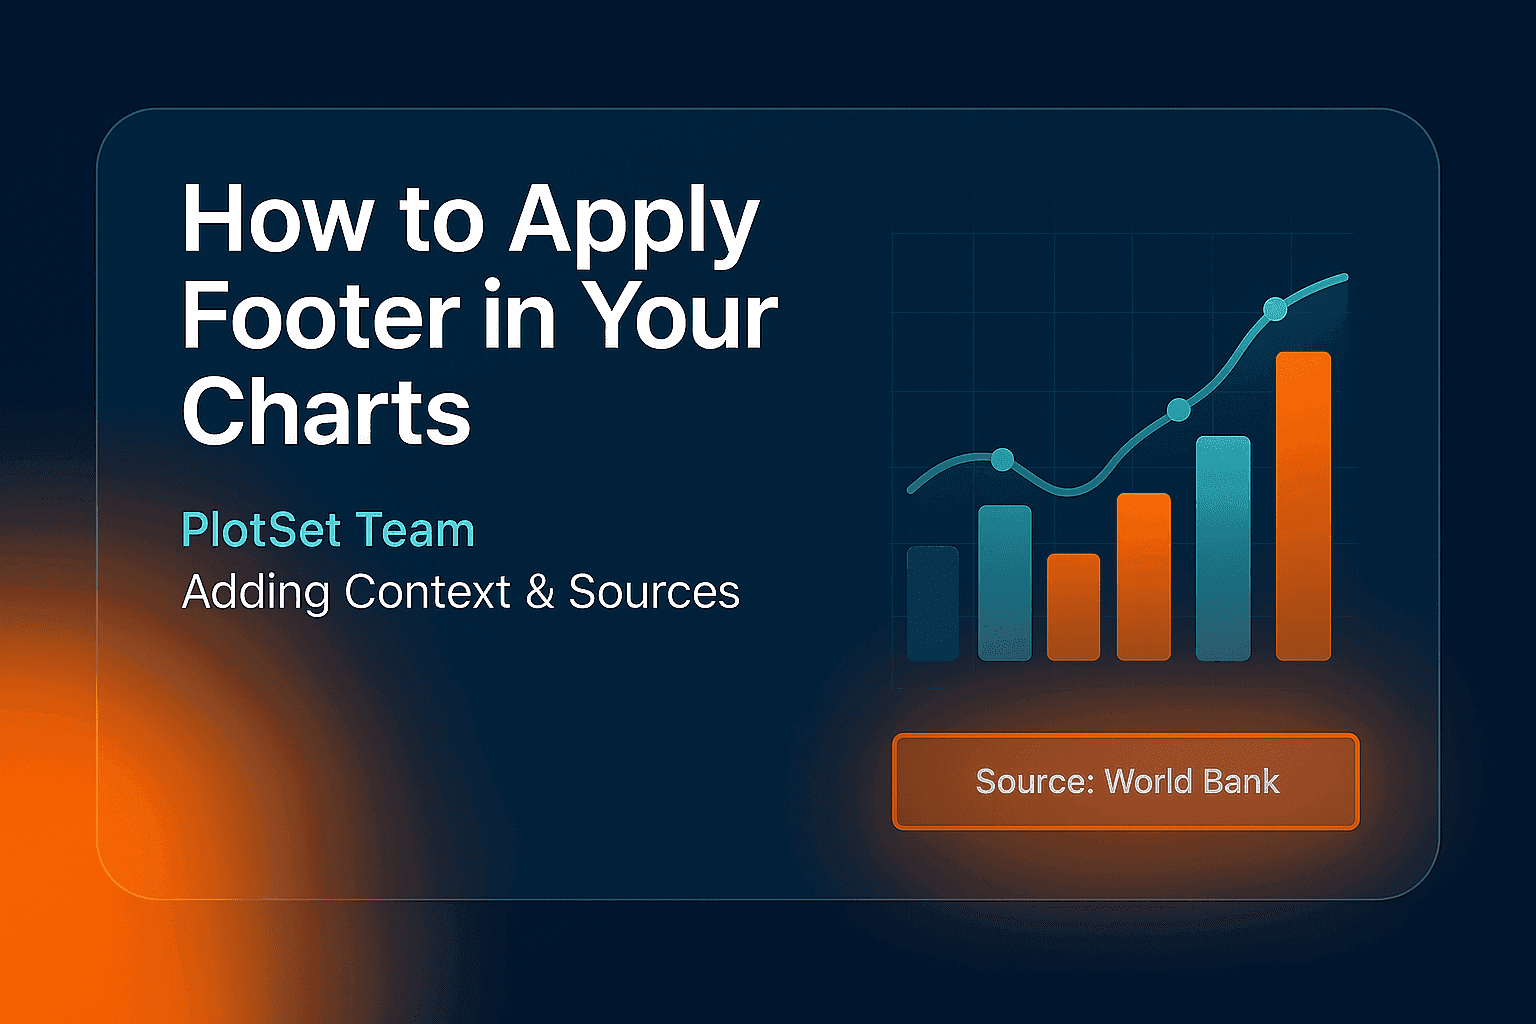
Discover the importance of using Footer to enhance the credibility and context of your data. Gain valuable insights and improve your data presentation skills.
阅读约 4 分钟

Learn how to optimize your chart's header for better data visualization and analysis.
阅读约 2 分钟

Enhance your charting skills with 3 easy ways to insert data when creating a new chart in PlotSet.
阅读约 2 分钟