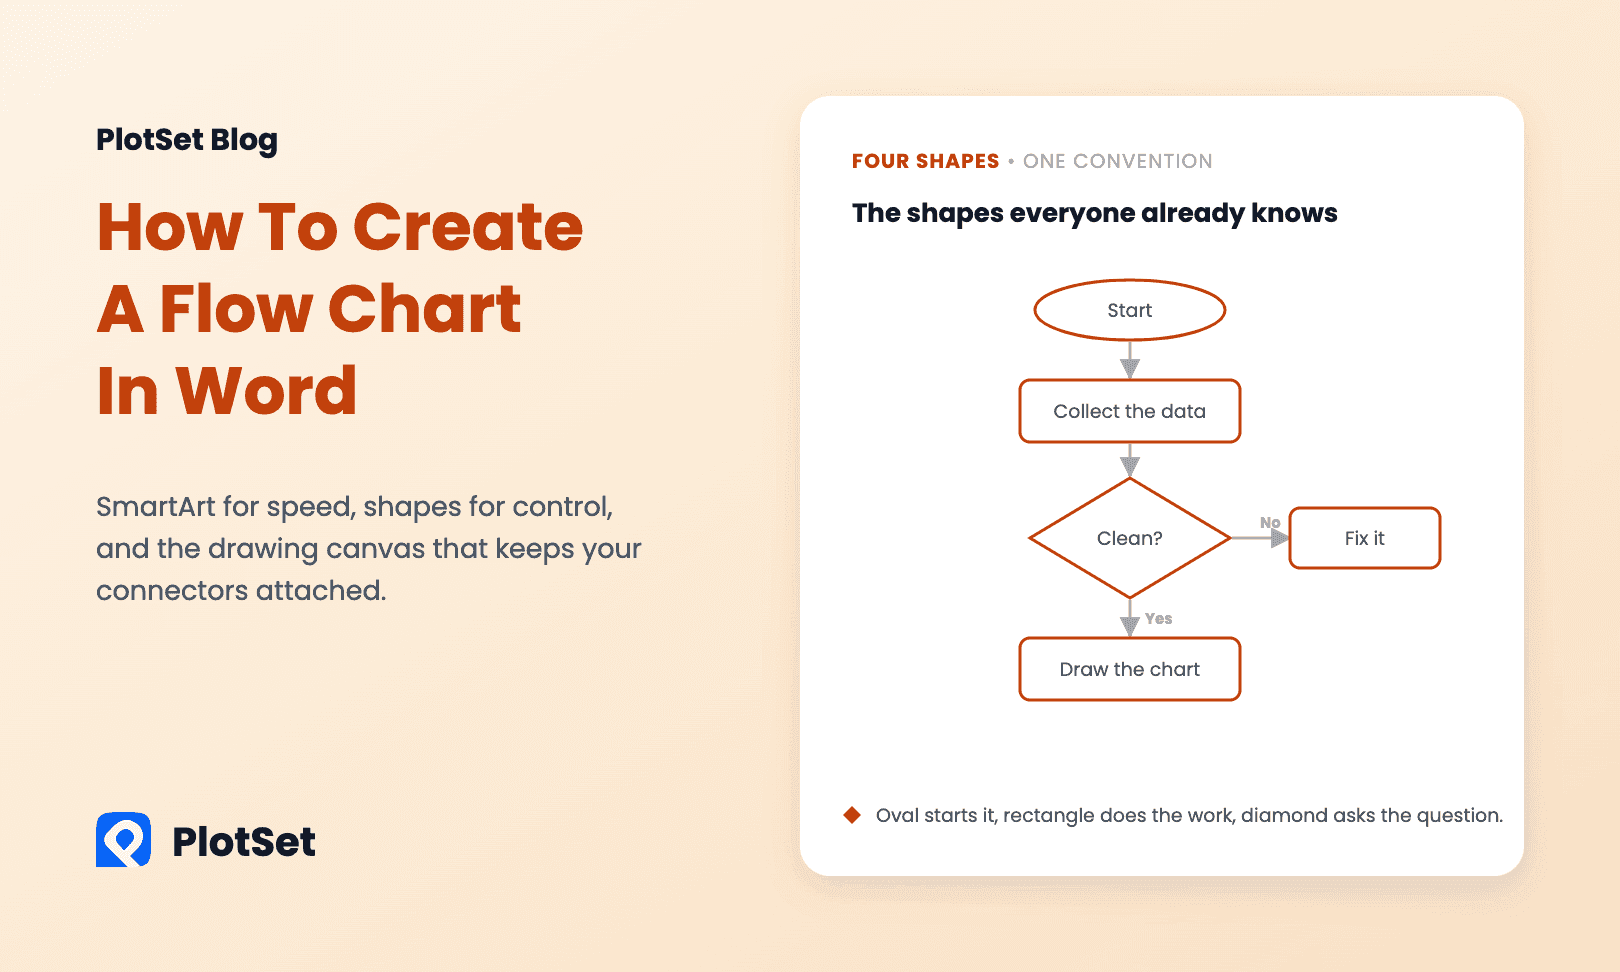
Word has two ways to build a flow chart, and picking the wrong one costs you an hour. SmartArt is fast and rigid: it lays the boxes out for you and resists anything that is not a straight sequence. Shapes are slower and unrestricted: you place every box and every arrow yourself, which is what you want the moment your process has a decision in it.
Here is how to do both properly, including the setting that stops your arrows detaching from the boxes every time you move something.
Before the first box: know the four shapes
Flow chart shapes are a convention, not decoration, and readers of a diagram already know them:
- Oval (terminator) — start and end.
- Rectangle (process) — a step, something that gets done.
- Diamond (decision) — a question with two labeled exits, usually Yes and No.
- Parallelogram (input/output) — data going in or coming out.
Use them as intended and your diagram needs no key. Mix them up — a diamond that is not a question, a rectangle that branches — and you have made a picture rather than a flow chart.
The fast way: SmartArt
Best for a linear process of five or six steps with no branching.
- Insert → SmartArt (in the Illustrations group).
- Choose Process on the left. Basic Chevron Process and Vertical Process are the two that read most cleanly in a document.
- Click OK, then open the Text Pane — the small arrow on the left edge of the graphic, or SmartArt Design → Text Pane.
- Type your steps into the pane as a bullet list. Enter adds a step, Tab demotes one into a sub-step. The layout redraws itself as you type.
- Restyle from SmartArt Design → Change Colors and the Styles gallery.
SmartArt's strength is that it stays aligned and resizes with your page. Its limit shows up the moment you need a decision diamond with two exits, because it wants to keep everything on one path. When you hit that wall, right-click the graphic and choose Convert to Shapes — you keep the layout and get full control of every element.
The flexible way: shapes on a drawing canvas
This is the part most tutorials skip, and it is the difference between a diagram you can edit and one you fight.
Start with a drawing canvas. Go to Insert → Shapes → New Drawing Canvas (it is at the bottom of the Shapes gallery). The canvas is a container that holds all your shapes together: connectors snap to shapes inside it, the whole diagram moves as one object, and lines stop wandering off when you edit the text around them. Without it, Word treats every box and arrow as a separate floating object anchored to a paragraph, and your arrows will drift.
Then:
- Insert → Shapes and pick from the Flowchart section — the shapes there are already the right ones, named on hover.
- Draw your first shape inside the canvas. Hold Shift while dragging to keep proportions.
- Type straight into a selected shape to add its label. There is no separate text box to manage.
- Copy the shape (Ctrl+D duplicates in place) rather than drawing each one — identical sizes are half of what makes a diagram look deliberate.
- Connect them with Insert → Shapes → Lines → Elbow Arrow Connector. Hover over a shape and small connection dots appear on its edges; start and end your connector on those dots. A connector attached to dots stays attached when you move the shape. One drawn to empty space does not.
- Label the exits from every diamond. An unlabeled branch is the most common flow chart defect there is.
Make it look intentional
- Align rather than eyeball. Select several shapes with Ctrl+click, then Shape Format → Align → Align Center and Distribute Vertically. Two clicks, and the diagram stops looking hand-placed.
- Turn on the grid while you work: View → Gridlines.
- Pick two colors, not seven. One fill for process steps, an accent for decisions, white for everything else. Set it once via Shape Format → Shape Styles.
- Keep the text short. A box is a label, not a sentence. If a step needs a sentence, the sentence belongs in the paragraph below the diagram.
- Group it when you are done: select all, right-click, Group. Now it moves as one object and nothing shifts when the text reflows.
When a flow chart is the wrong diagram
A flow chart shows the sequence of steps and the decisions between them. It does not show volume — how many cases went each way. If the interesting part of your process is that 82 percent of applications take the left branch and 18 percent the right, boxes and arrows will not carry that, no matter how carefully you draw them.
That is a sankey diagram: the same paths drawn with widths proportional to the number flowing along them, so the reader sees where the volume actually goes. Website traffic through a funnel, budget through departments, applicants through hiring stages — anything where quantity matters more than sequence. It takes a two-column table of source, target and value, and you can embed the result in a page rather than pasting an image of it.
For process documentation, though, Word's shapes are genuinely fine. Use the canvas, use the four shapes as intended, label the branches, and the diagram will survive the next edit.
FAQ
Does Word have a flow chart template? Not a dedicated one, but SmartArt's Process layouts are effectively templates: Insert → SmartArt → Process gives you a ready-made diagram you fill in through the Text Pane. For anything with branching, start from Shapes instead.
How do I connect two shapes in Word so the arrow stays attached? Draw both shapes inside a drawing canvas (Insert → Shapes → New Drawing Canvas), then use a connector from the Lines group. Hover over a shape until connection points appear on its edges and snap each end of the connector to one. Connectors anchored that way follow the shapes when you move them.
How do I add text inside a flow chart shape? Click the shape and type. To adjust the fit, right-click → Format Shape → Text Options → Text Box, and set the internal margins or turn on "Shrink text on overflow".
Should I use SmartArt or shapes? SmartArt when the process is a straight line and you want it done in two minutes. Shapes when there is a decision, a loop, or a parallel path. You can always start in SmartArt and use Convert to Shapes when the layout stops cooperating.
Can I make a flow chart in Excel or PowerPoint instead? Yes — the Shapes and SmartArt tools are identical across Office, and PowerPoint's larger canvas and alignment guides make it the easier place to draw a big diagram. Build it there, then paste it into Word as a picture or a grouped object.