
Chaque graphique ici a commencé dans un tableur.
Cartes, bar chart races, treemaps, pictogrammes et plus. Ouvrez-en un et refaites-le avec vos données.
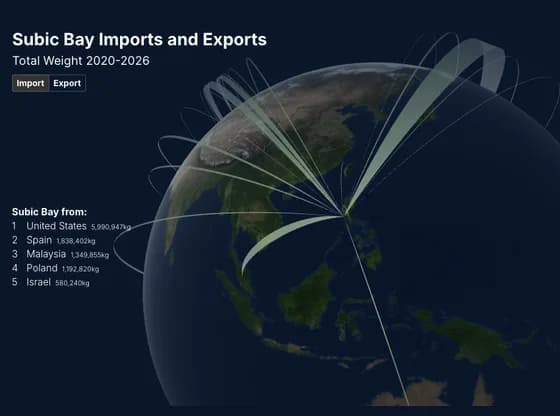 Connections and flow mapsSubic Bay Imports and Exports
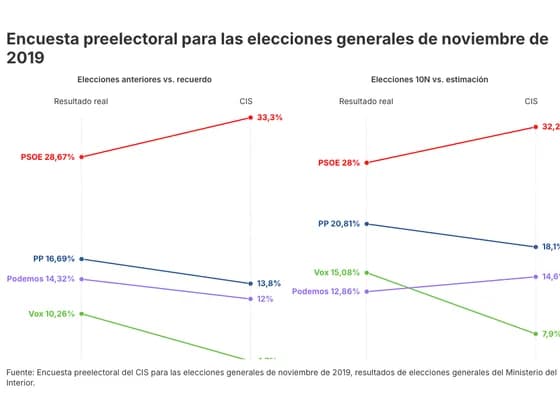 Slope chartEncuesta preelectoral para las elecciones generales de noviembre de 2019
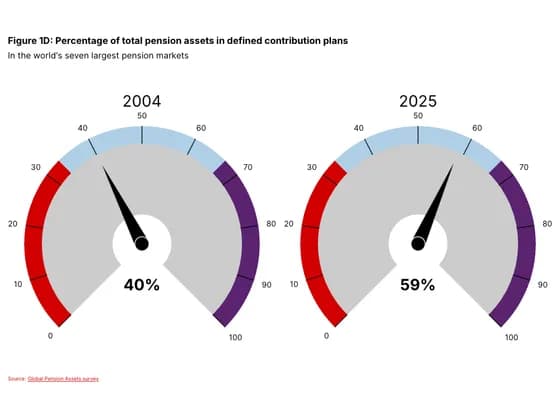 Counters and gaugesFigure 1D: Percentage of total pension assets in defined contribution plans
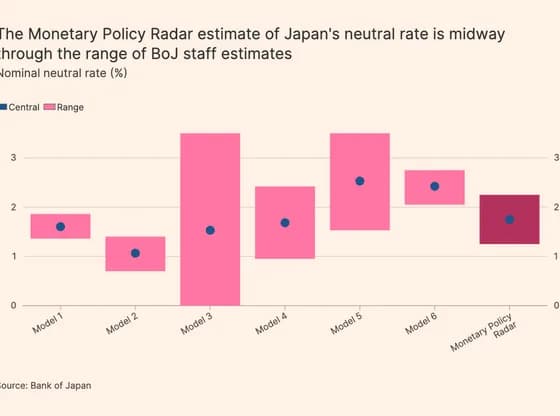 Line, bar and pie chartsThe Monetary Policy Radar estimate of Japan's neutral rate is midway through the range of BoJ…
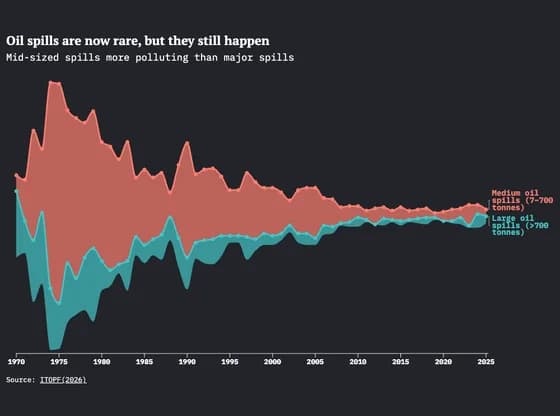 Line, bar and pie chartsOil spills are now rare, but they still happen
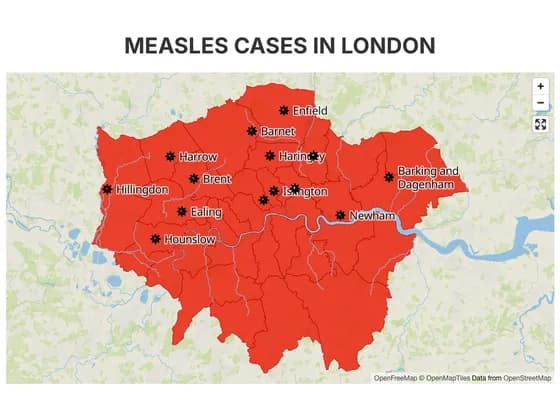 3D mapMEASLES CASES IN LONDON
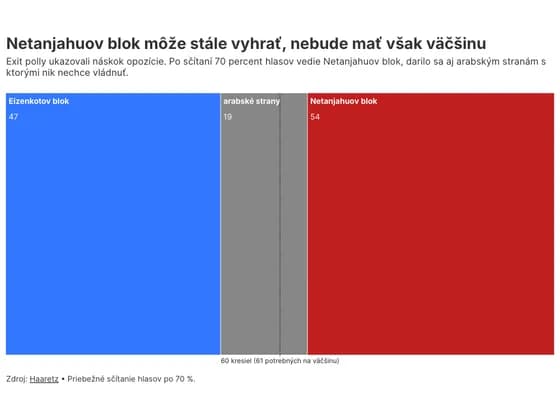 Elections and parliamentsNetanjahuov blok môže stále vyhrať, nebude mať však väčšinu
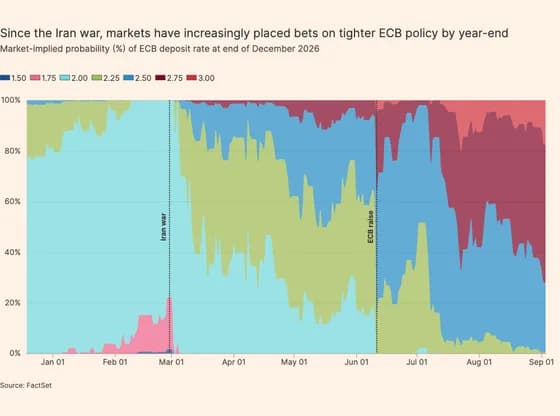 Line, bar and pie chartsSince the Iran war, markets have increasingly placed bets on tighter ECB policy by year-end
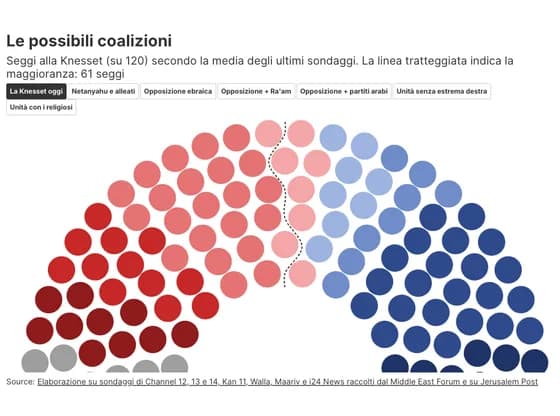 Elections and parliamentsLe possibili coalizioni
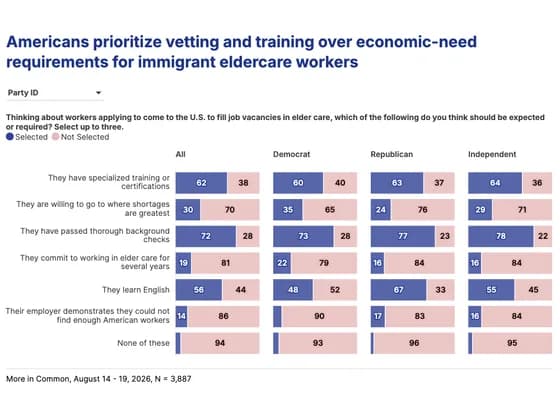 Line, bar and pie chartsAmericans prioritize vetting and training over economic-need requirements for immigrant…
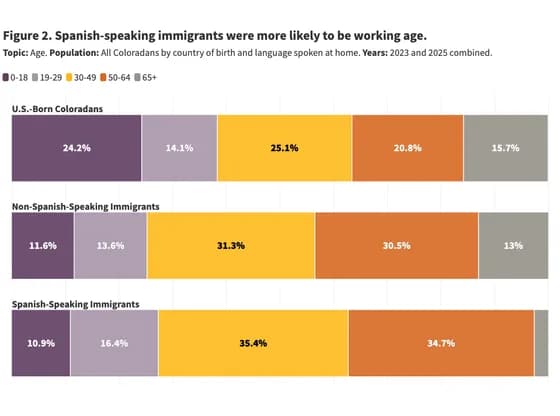 Line, bar and pie chartsFigure 2. Spanish-speaking immigrants were more likely to be working age.
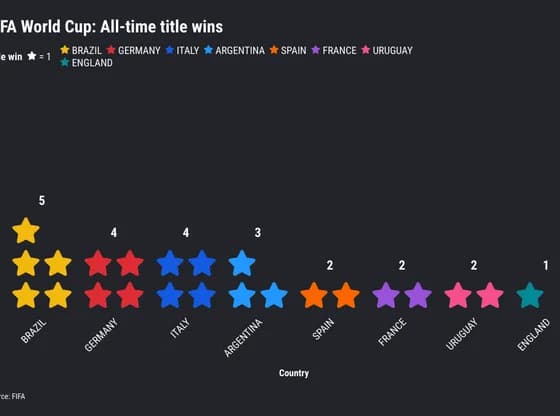 PictogramFIFA World Cup: All-time title wins
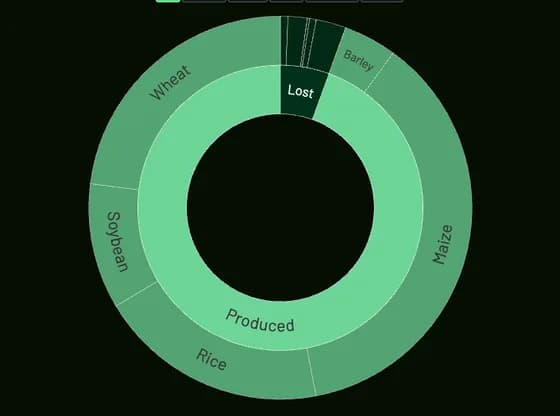 Hierarchy616.4 trillion kcal were lost
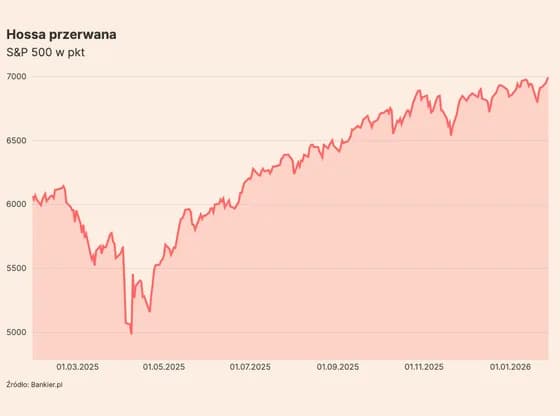 Line, bar and pie chartsHossa przerwana
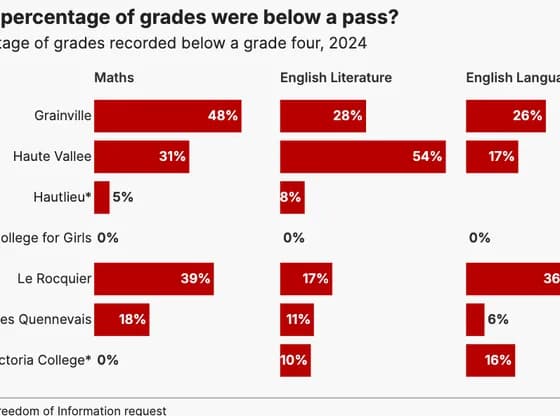 Line, bar and pie chartsWhat percentage of grades were below a pass?
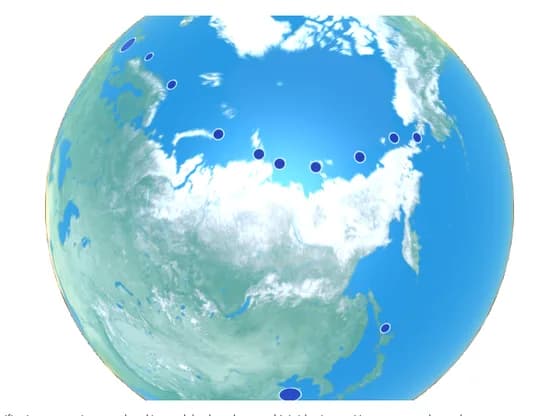 3D globeDubai Tower's journey along the 'Ice Silk Road'
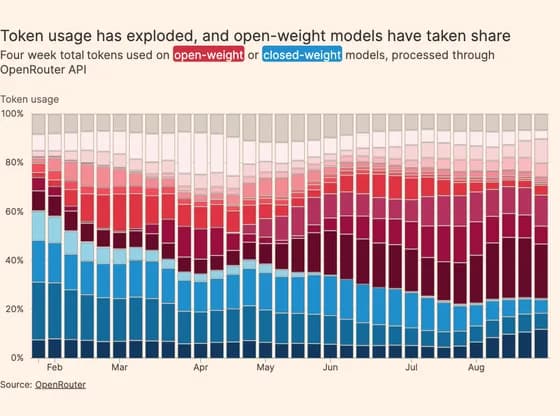 Line, bar and pie chartsToken usage has exploded, and open-weight models have taken share
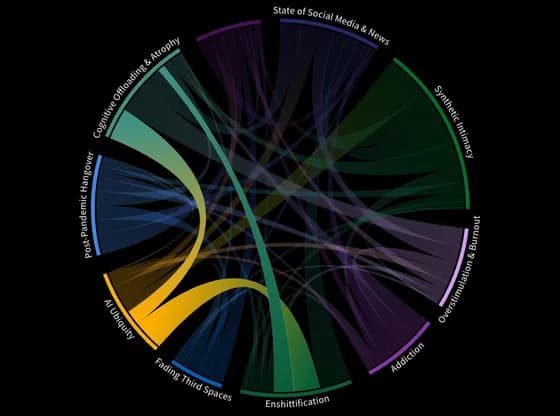 Network graphSeptember+disconnect, loneliness, state of social
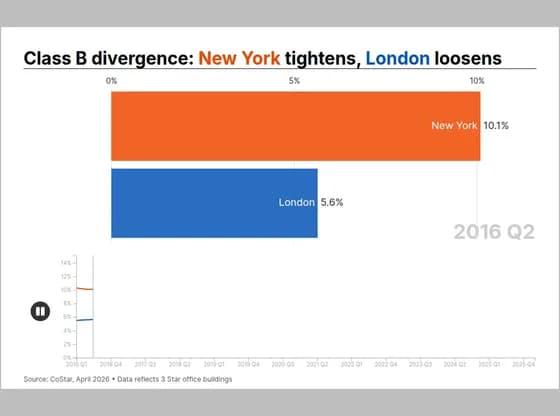 Animated chartsClass B divergence: New York tightens, London loosens
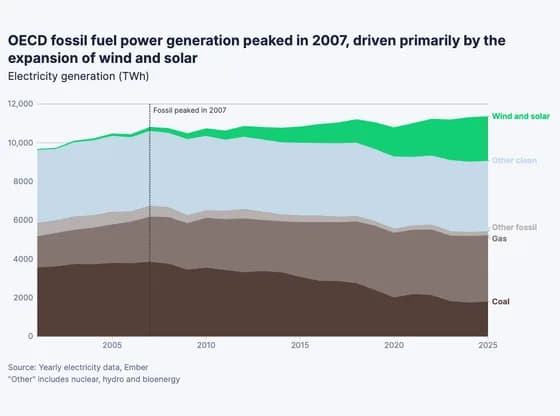 Line, bar and pie chartsOECD fossil fuel power generation peaked in 2007, driven primarily by the expansion of wind and…