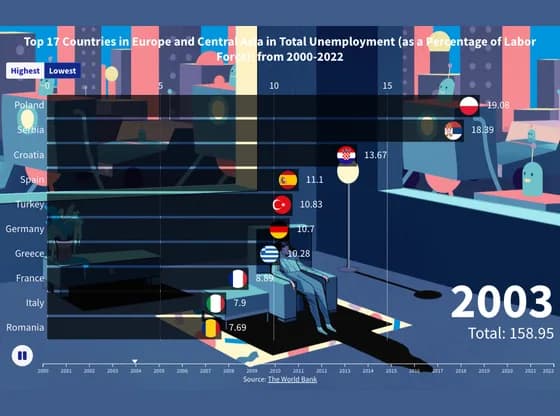
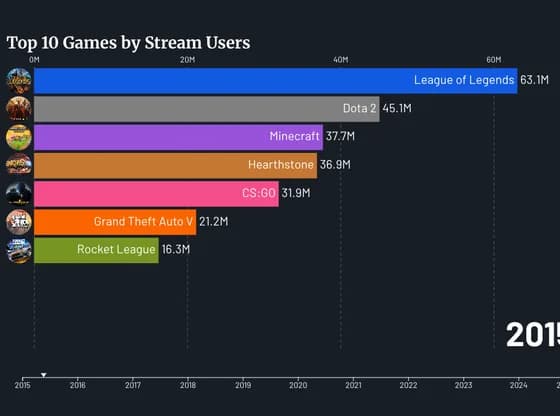
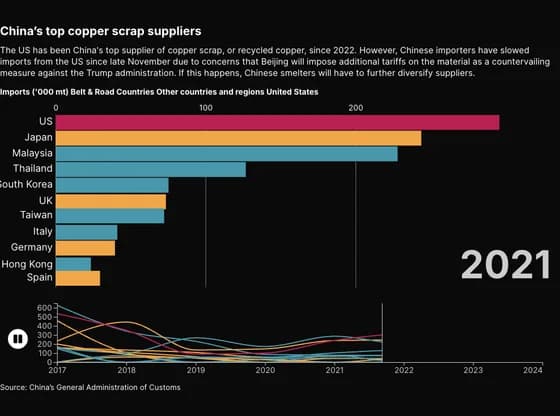
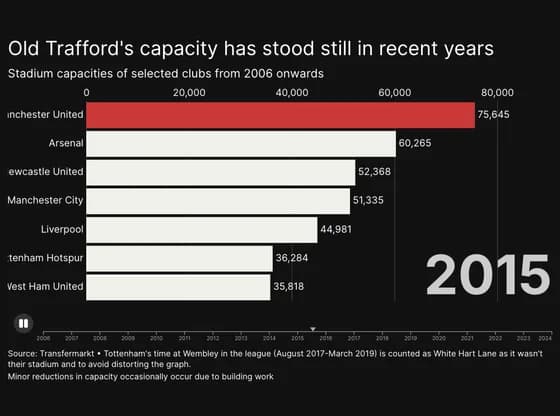
Chaque graphique ici a commencé dans un tableur.
Cartes, bar chart races, treemaps, pictogrammes et plus. Ouvrez-en un et refaites-le avec vos données.
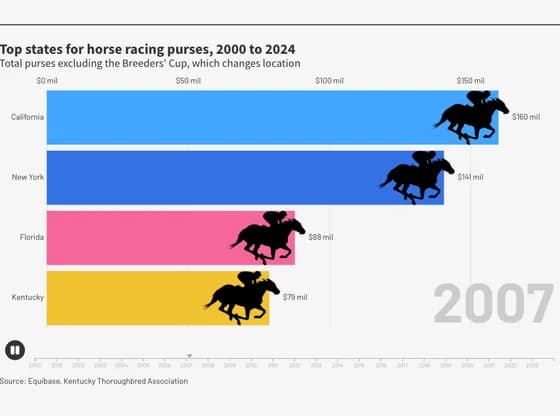 Animated chartsTop states for horse racing purses, 2000 to 2024
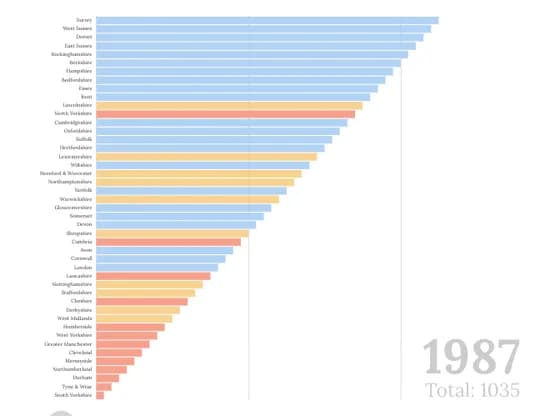 Animated chartsEnglish counties ranked by Conservative vote share
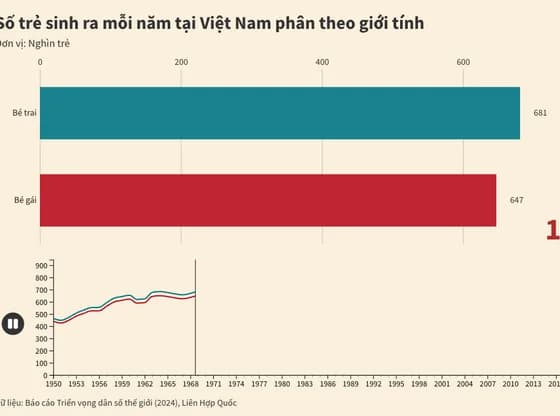 Animated chartsSố trẻ sinh ra mỗi năm tại Việt Nam phân theo giới tính
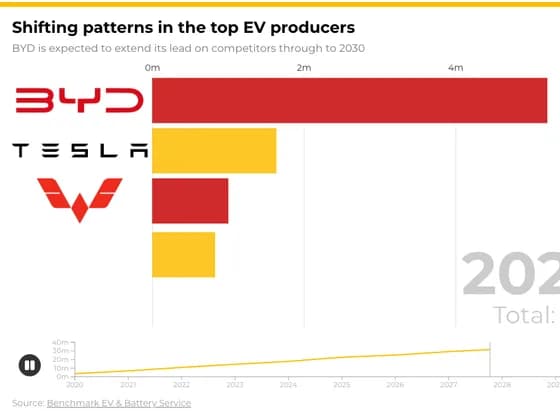 Animated chartsShifting patterns in the top EV producers
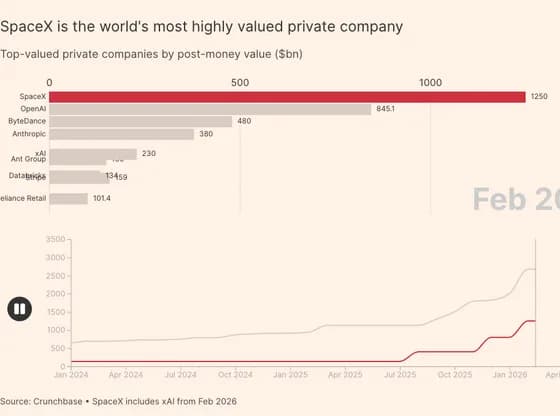 Animated chartsSpaceX is the world's most highly valued private company
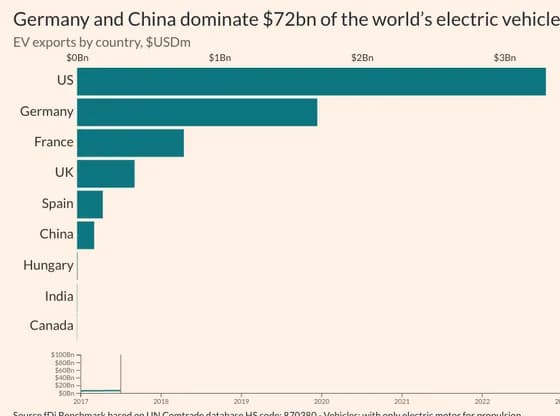 Animated chartsGermany and China dominate $72bn of the world’s electric vehicle exports
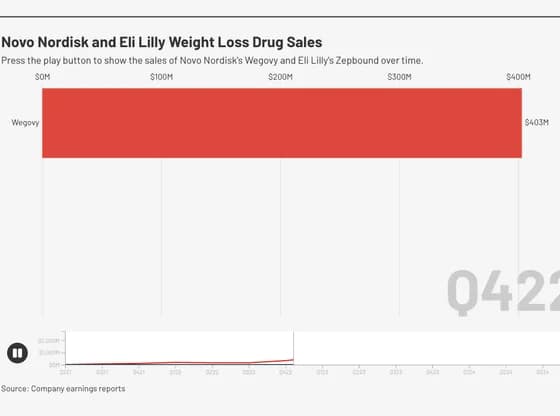 Animated chartsNovo Nordisk and Eli Lilly Weight Loss Drug Sales
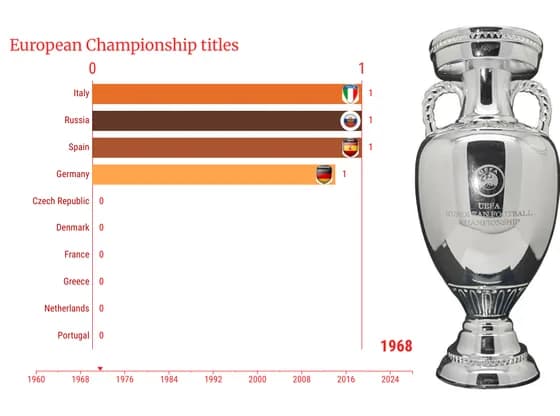 Animated chartsEuropean Championship titles
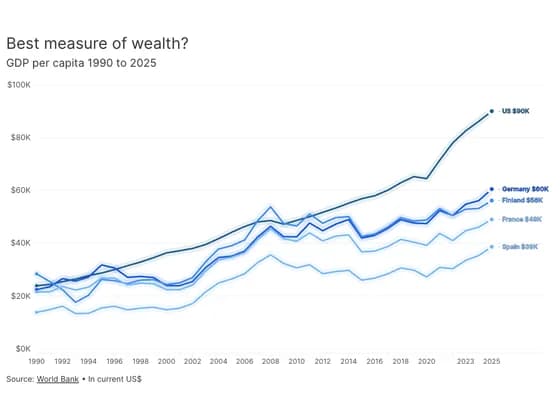 Animated chartsBest measure of wealth?
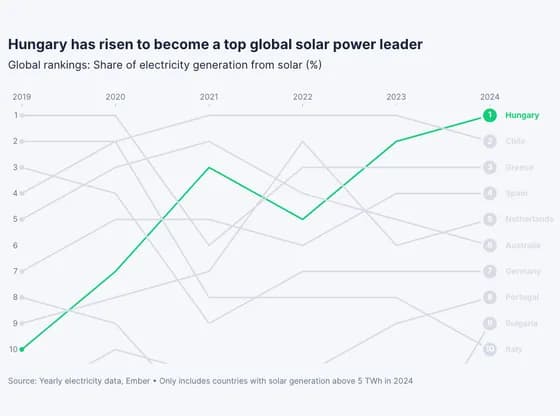 Animated chartsHungary has risen to become a top global solar power leader
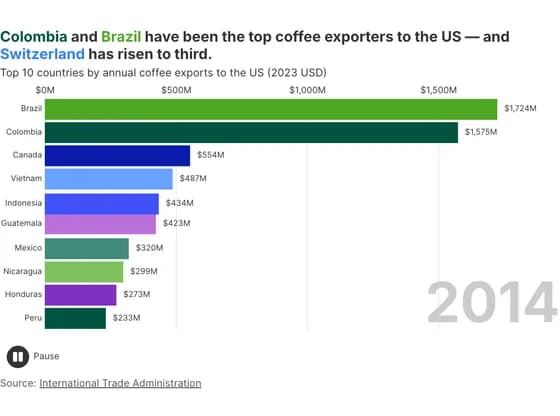 Animated chartsColombia and Brazil have been the top coffee exporters to the US — and Switzerland has risen to…
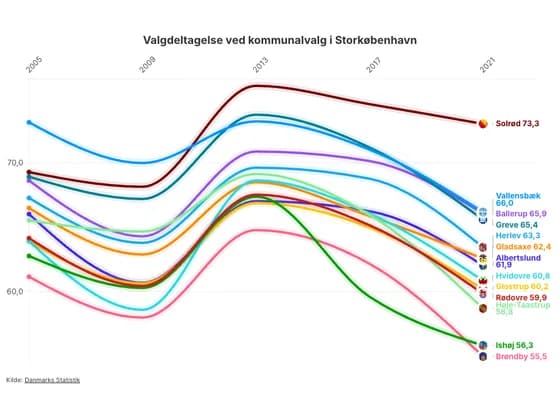 Animated chartsValgdeltagelse ved kommunalvalg i Storkøbenhavn
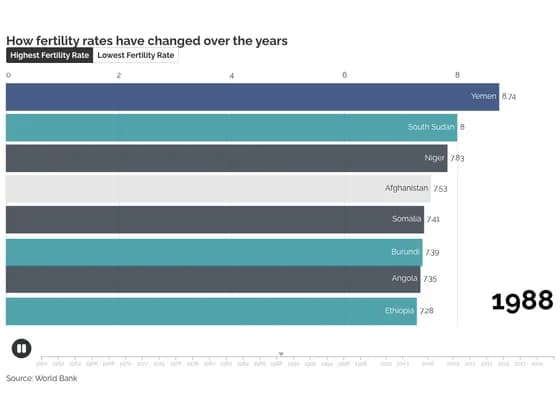 Animated chartsHow fertility rates have changed over the years
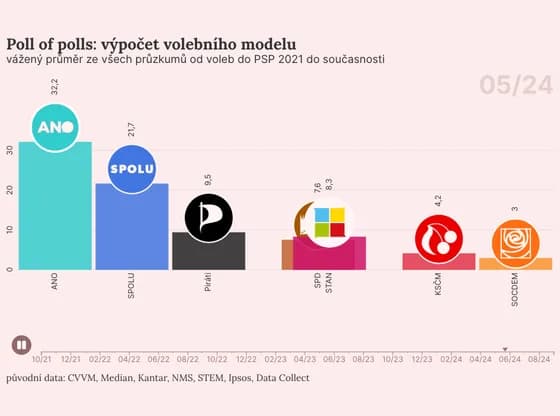 Animated chartsPoll of polls: výpočet volebního modelu
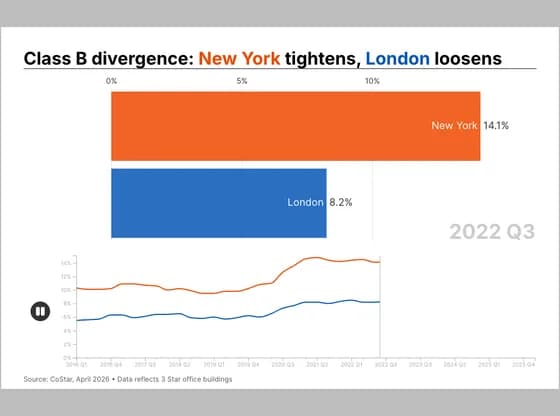 Animated chartsClass B divergence: New York tightens, London loosens
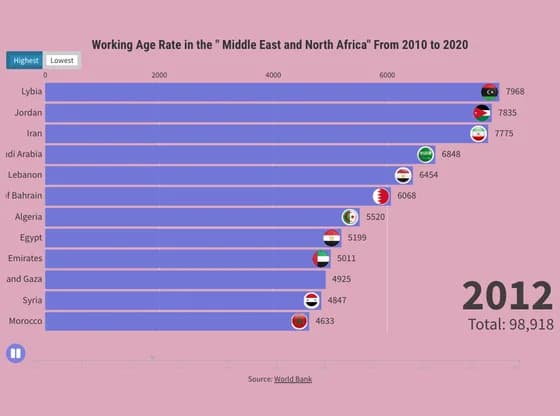 Animated chartsWorking Age Rate in the " Middle East and North Africa" From 2010 to 2020
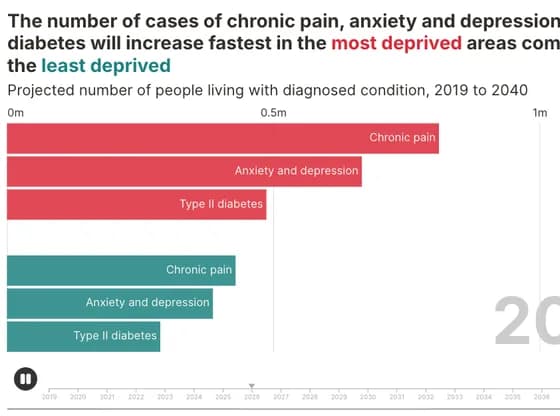 Animated chartsThe number of cases of chronic pain, anxiety and depression and diabetes will increase fastest…
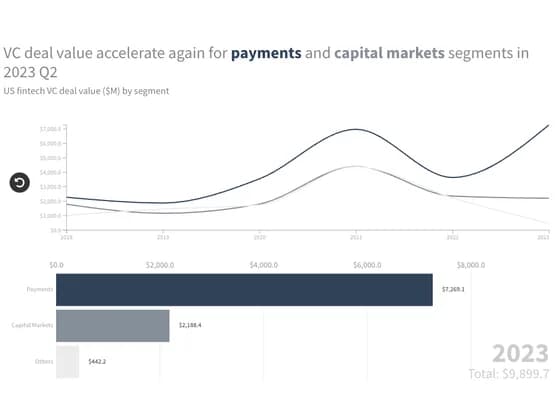 Animated chartsVC deal value accelerate again for payments and capital markets segments in 2023 Q2
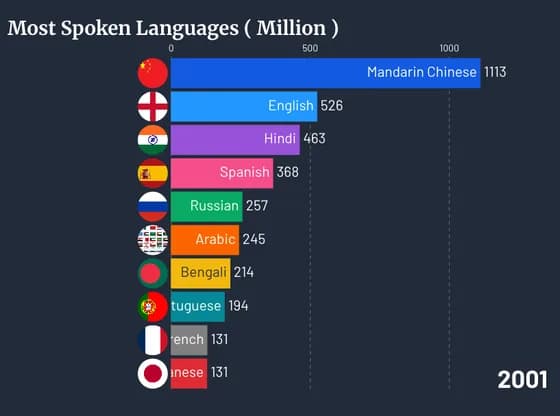
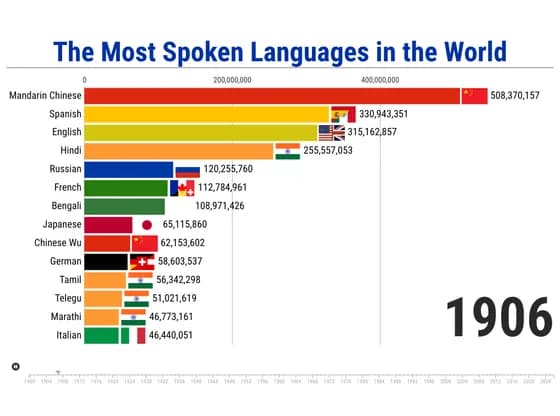 Animated chartsThe Most Spoken Languages in the World
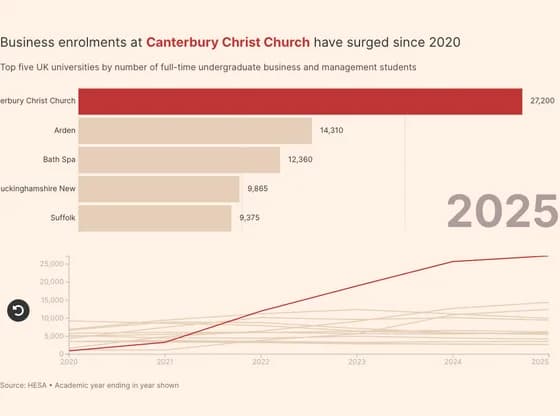 Animated chartsBusiness enrolments at Canterbury Christ Church have surged since 2020
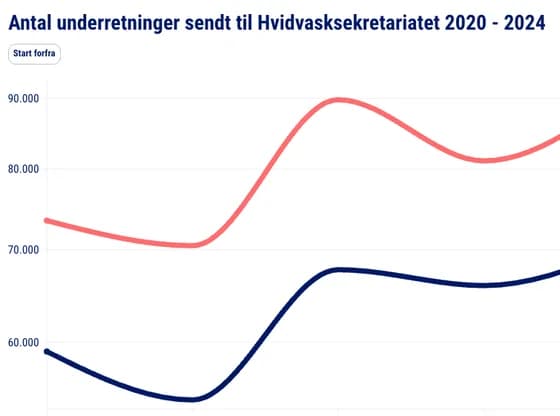 Animated chartsAntal underretninger sendt til Hvidvasksekretariatet 2020 - 2024
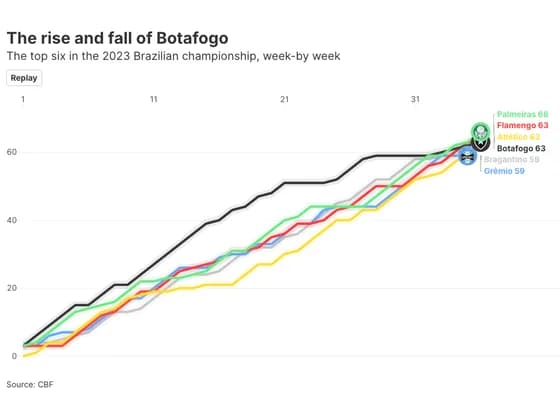 Animated chartsThe rise and fall of Botafogo