
Chaque graphique ici a commencé dans un tableur.
Cartes, bar chart races, treemaps, pictogrammes et plus. Ouvrez-en un et refaites-le avec vos données.
 OtherI. Contributions
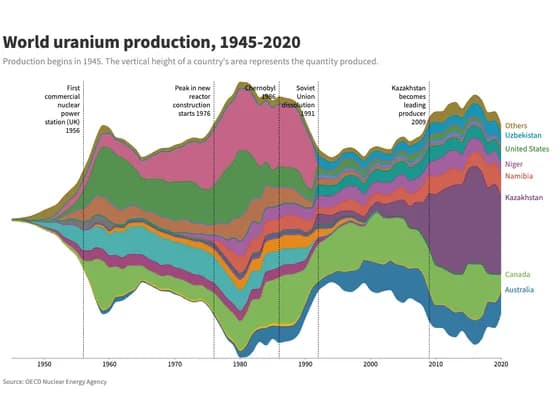 Line, bar and pie chartsWorld uranium production, 1945-2020
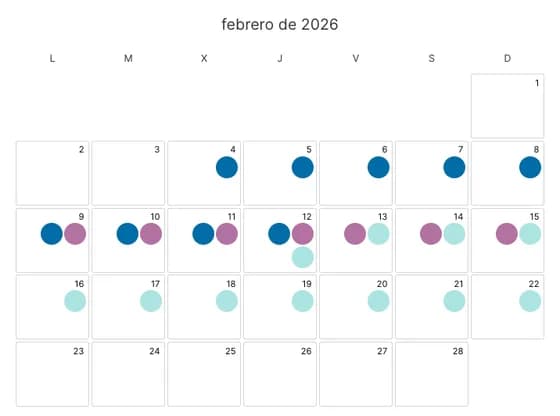 3D plotsCalendario de las pruebas de trineo en Milano Cortina 2026
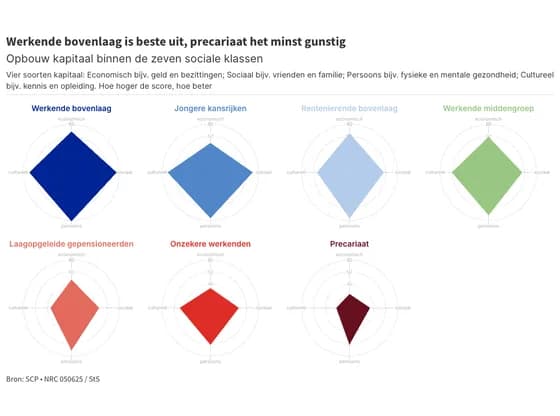 Radar chartWerkende bovenlaag is beste uit, precariaat het minst gunstig
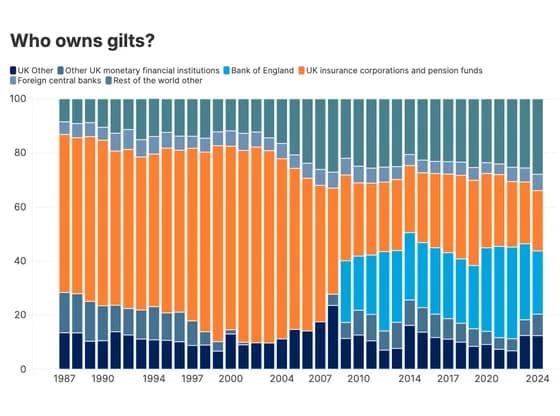 Line, bar and pie chartsWho owns gilts?
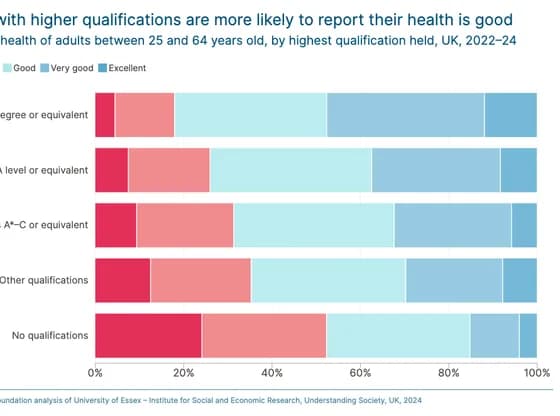 Line, bar and pie chartsPeople with higher qualifications are more likely to report their health is good
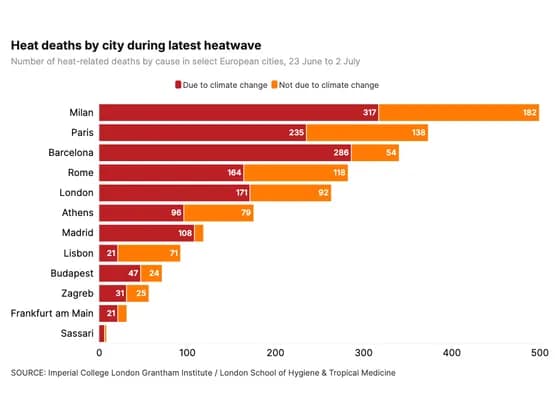 Line, bar and pie chartsHeat deaths by city during latest heatwave
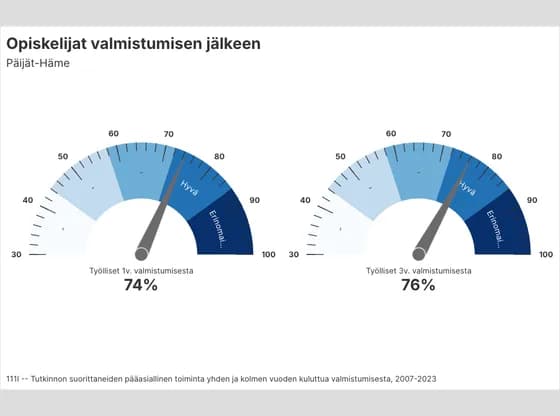 Counters and gaugesOpiskelijat valmistumisen jälkeen
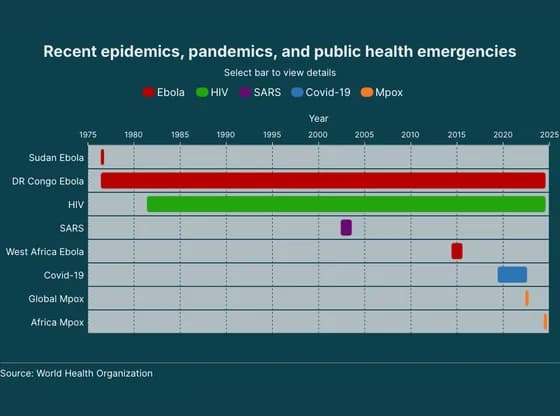 Gantt chartRecent epidemics, pandemics, and public health emergencies
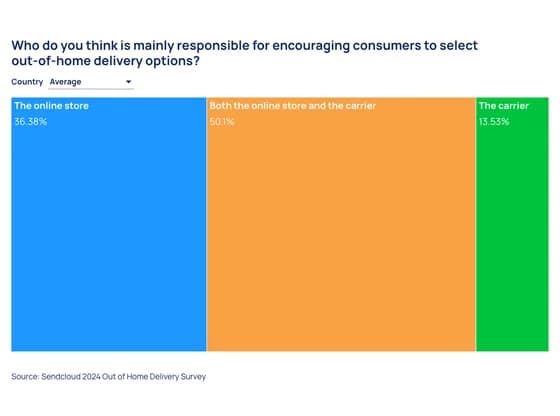 Elections and parliamentsWho do you think is mainly responsible for encouraging consumers to select out-of-home delivery…
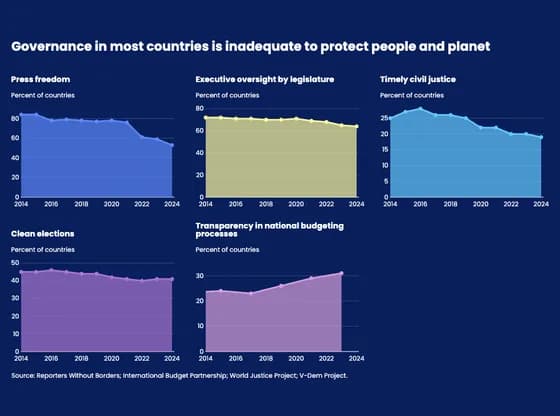 Line, bar and pie chartsGovernance in most countries is inadequate to protect people and planet
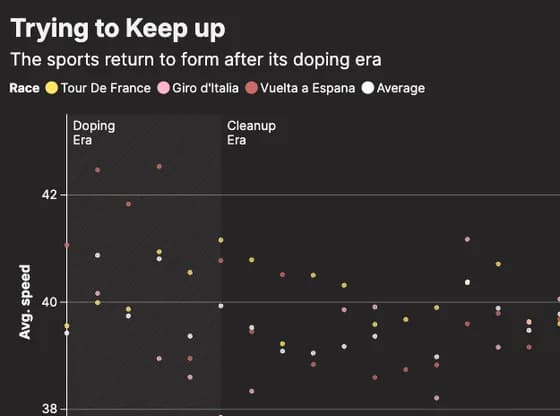 ScatterTrying to Keep up
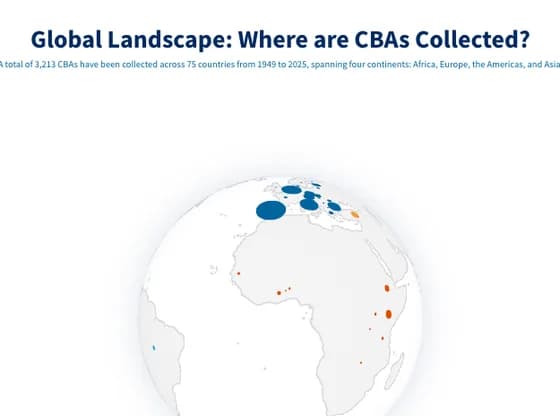 3D globeGlobal Landscape: Where are CBAs Collected?
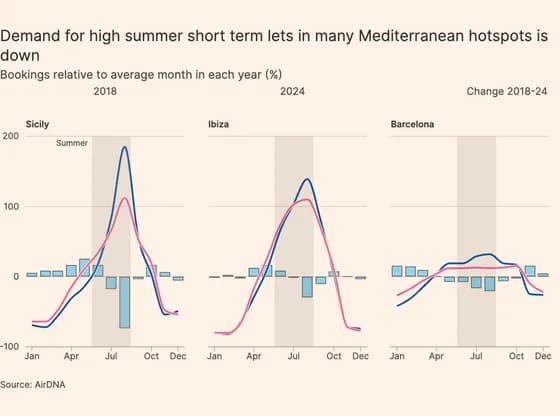 Line, bar and pie chartsDemand for high summer short term lets in many Mediterranean hotspots is down
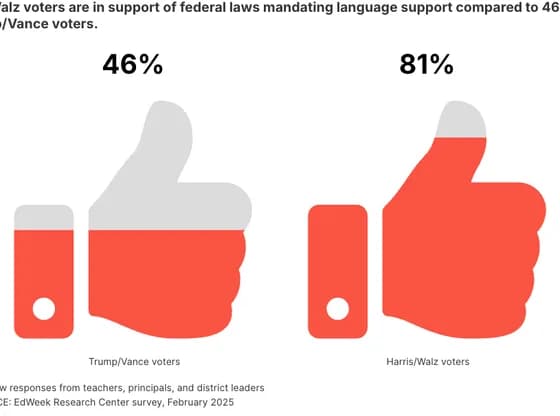 PictogramAmong educators who serve neither foreign-born nor English-learner students, 81 percent of…
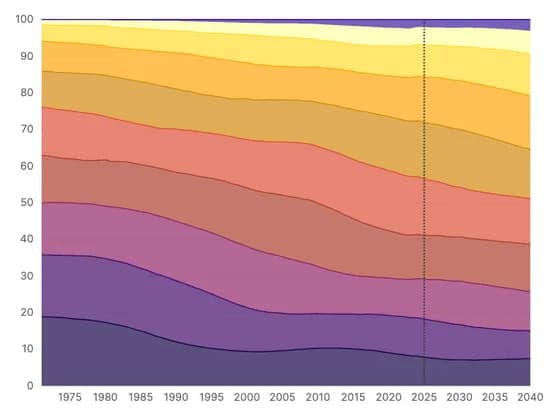 Line, bar and pie chartsFigura 4. Evolució de la població per grups d’edat (%), 1971-2040
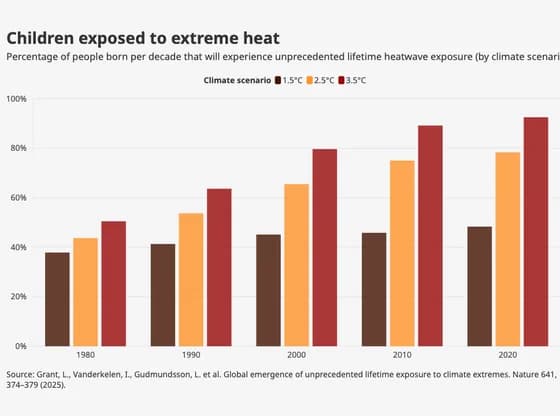 Line, bar and pie chartsChildren exposed to extreme heat
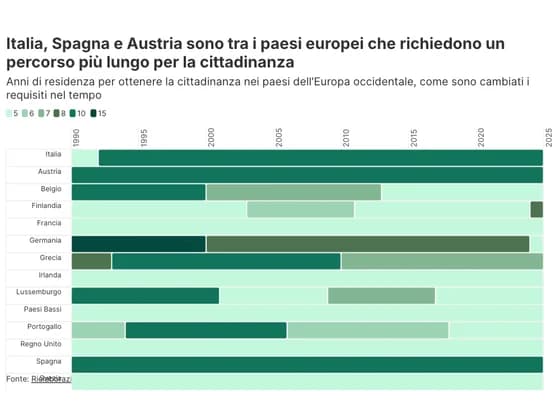 Gantt chartItalia, Spagna e Austria sono tra i paesi europei che richiedono un percorso più lungo per la…
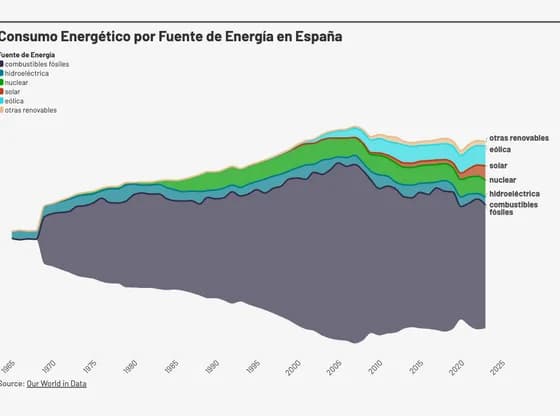 Line, bar and pie chartsConsumo Energético por Fuente de Energía en España
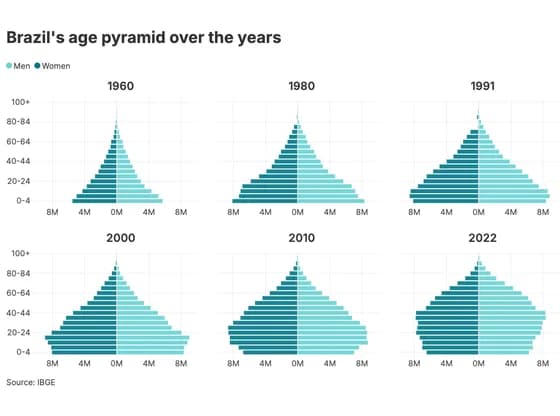 Line, bar and pie chartsBrazil's age pyramid over the years