
Chaque graphique ici a commencé dans un tableur.
Cartes, bar chart races, treemaps, pictogrammes et plus. Ouvrez-en un et refaites-le avec vos données.
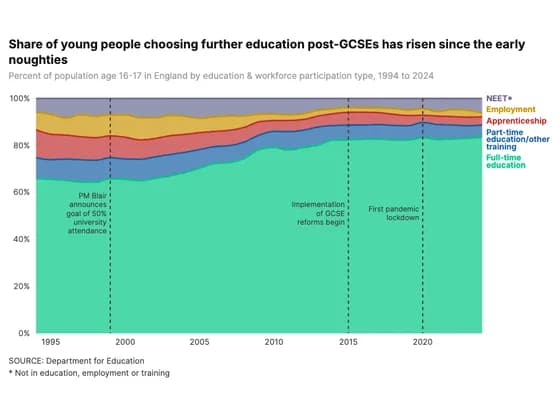 Line, bar and pie chartsShare of young people choosing further education post-GCSEs has risen since the early noughties
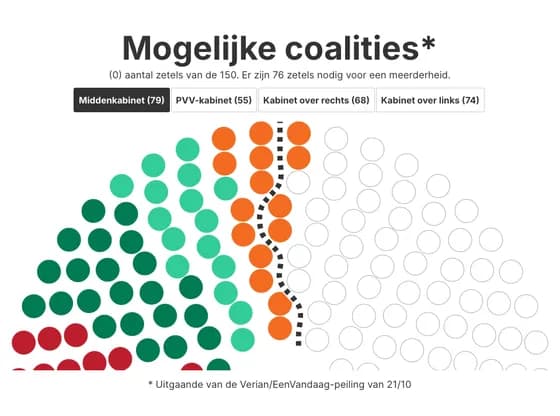 Elections and parliamentsMogelijke coalities*
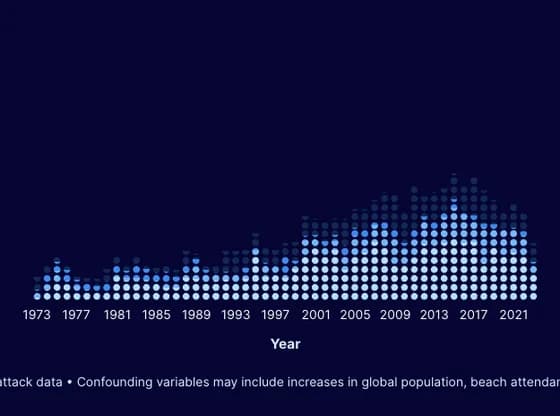 PictogramAre Shark attacks on the up?
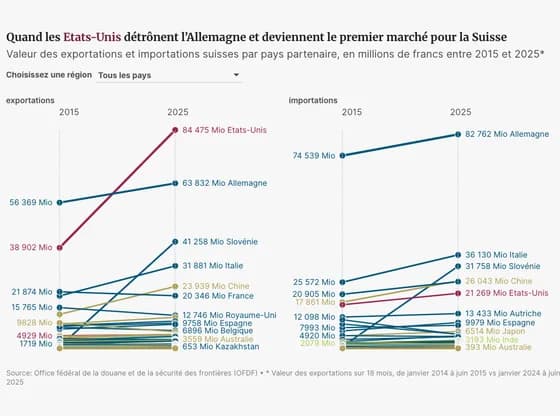 Slope chartQuand les Etats-Unis détrônent l’Allemagne et deviennent le premier marché pour la Suisse
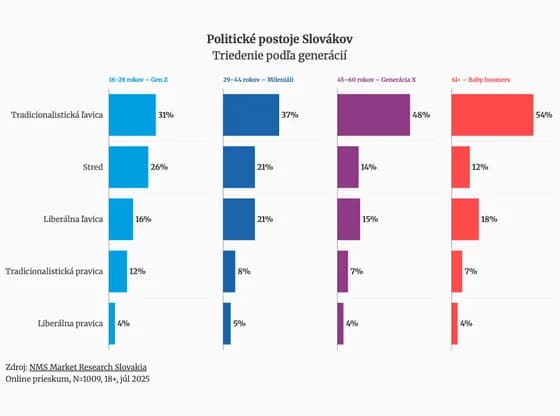 Line, bar and pie chartsPolitické postoje Slovákov
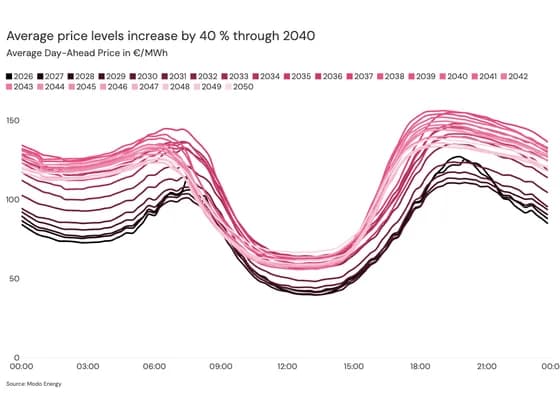 Line, bar and pie chartsAverage price levels increase by 40 % through 2040
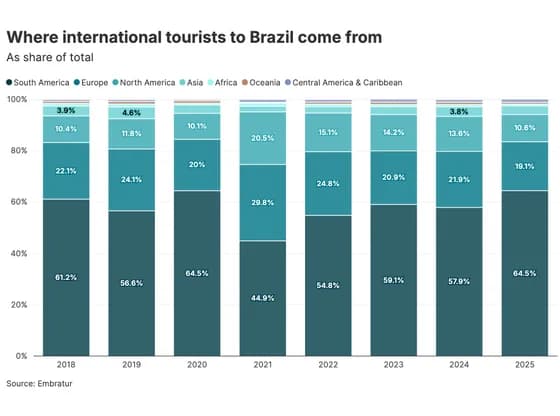 Line, bar and pie chartsWhere international tourists to Brazil come from
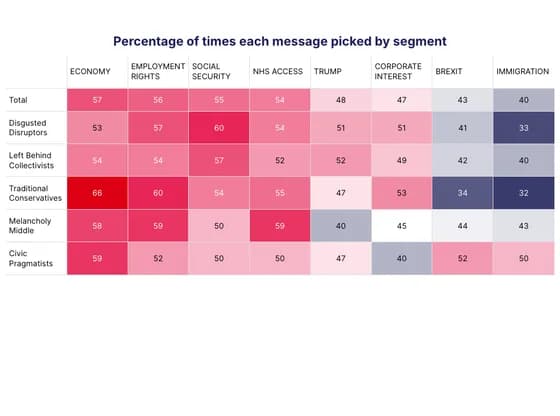 TablePercentage of times each message picked by segment
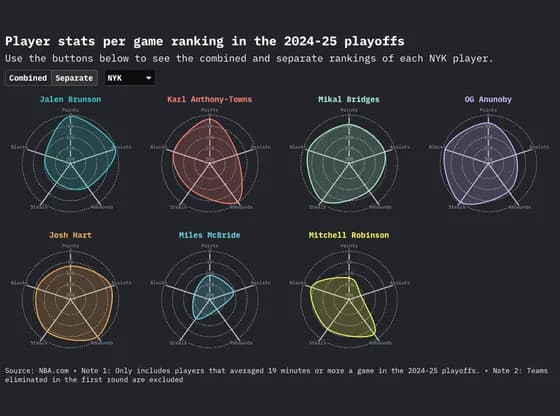 Radar chartPlayer stats per game ranking in the 2024-25 playoffs
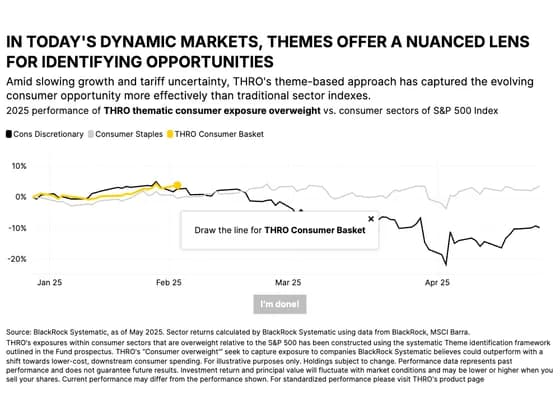 Interactive toolsIN TODAY'S DYNAMIC MARKETS, THEMES OFFER A NUANCED LENS FOR IDENTIFYING OPPORTUNITIES
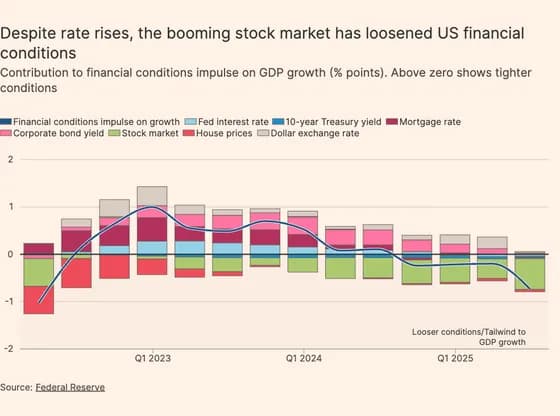 Line, bar and pie chartsDespite rate rises, the booming stock market has loosened US financial conditions
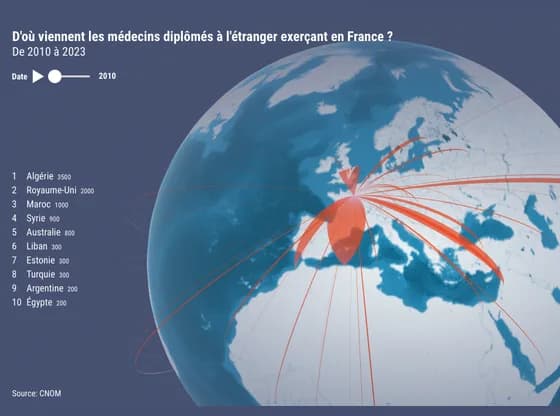 Connections and flow mapsD'où viennent les médecins diplômés à l'étranger exerçant en France ?
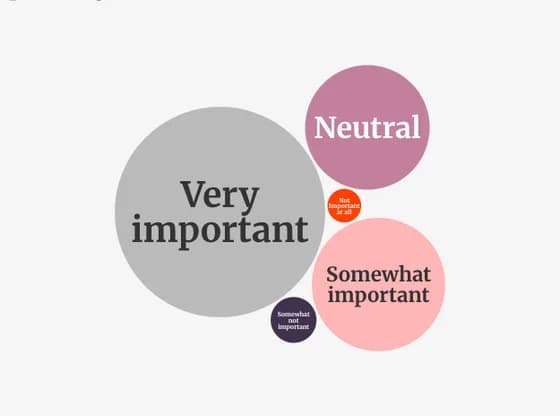 Distribution chartsTo what extent is it important to you to support the freedom of the press?
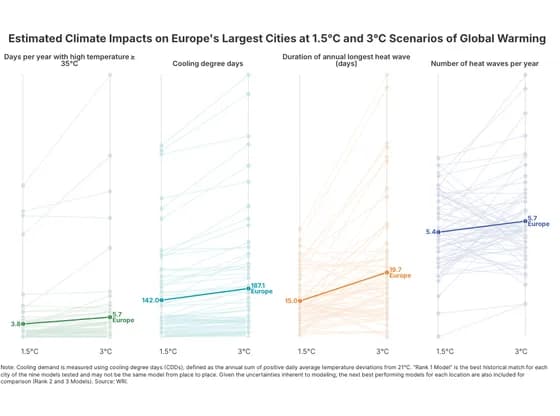 Slope chartEstimated Climate Impacts on Europe's Largest Cities at 1.5°C and 3°C Scenarios of Global Warming
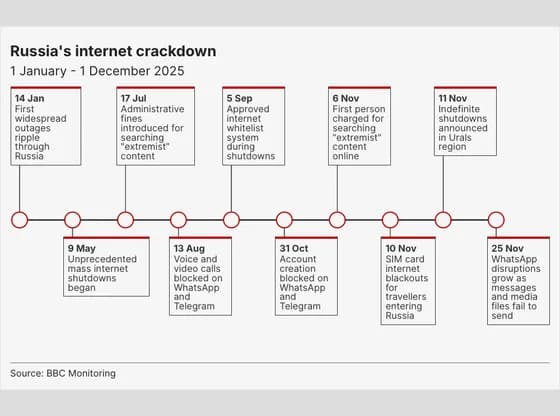 TimelineRussia's internet crackdown
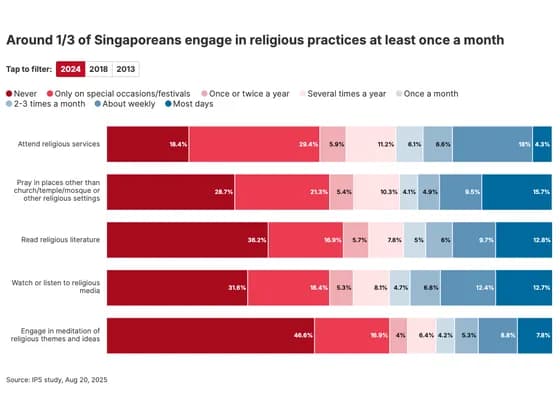 Line, bar and pie chartsAround 1/3 of Singaporeans engage in religious practices at least once a month
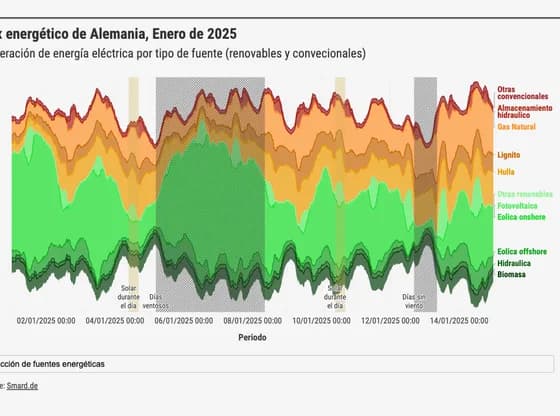 Line, bar and pie chartsMix energético de Alemania, Enero de 2025
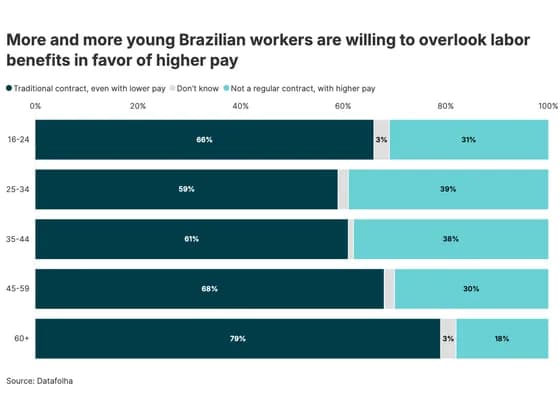 Line, bar and pie chartsMore and more young Brazilian workers are willing to overlook labor benefits in favor of higher pay
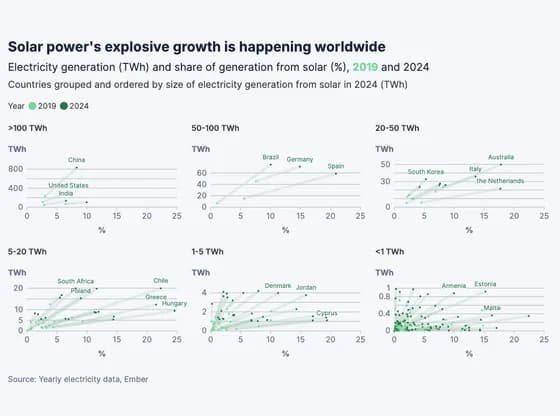 ScatterSolar power's explosive growth is happening worldwide
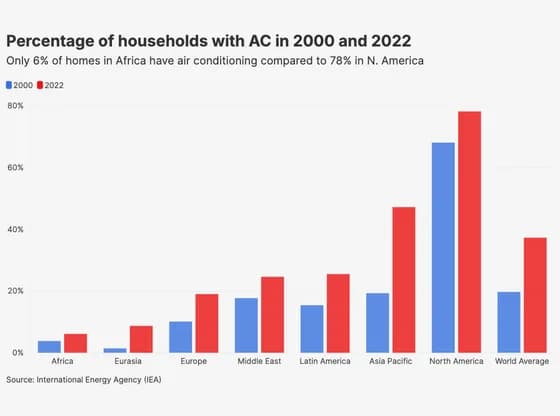 Line, bar and pie chartsPercentage of households with AC in 2000 and 2022