
Chaque graphique ici a commencé dans un tableur.
Cartes, bar chart races, treemaps, pictogrammes et plus. Ouvrez-en un et refaites-le avec vos données.
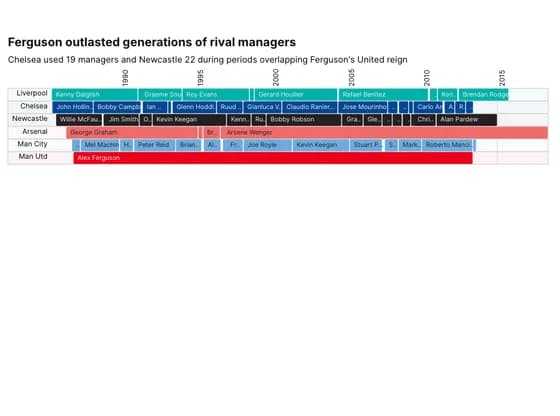 Gantt chartFerguson outlasted generations of rival managers
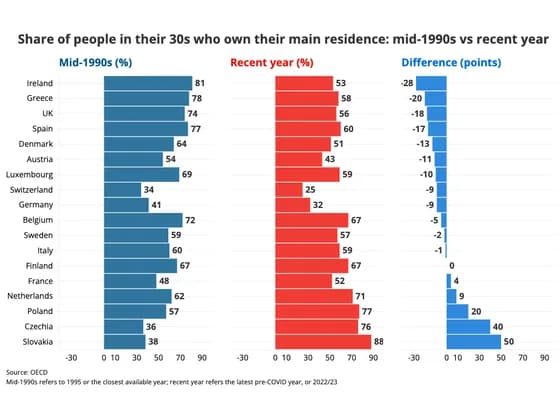 Line, bar and pie chartsShare of people in their 30s who own their main residence: mid-1990s vs recent year
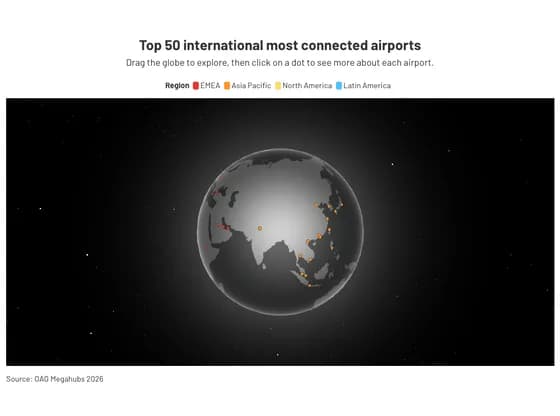 3D globeTop 50 international most connected airports
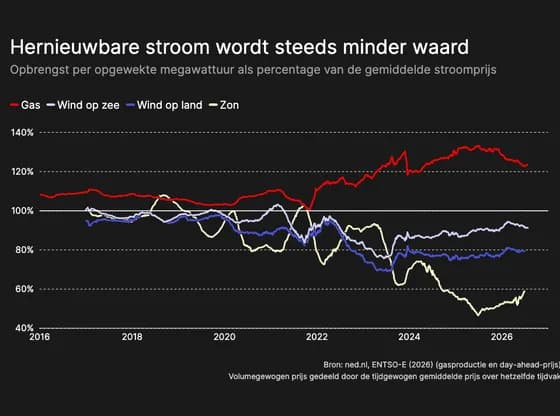 Line, bar and pie chartsHernieuwbare stroom wordt steeds minder waard
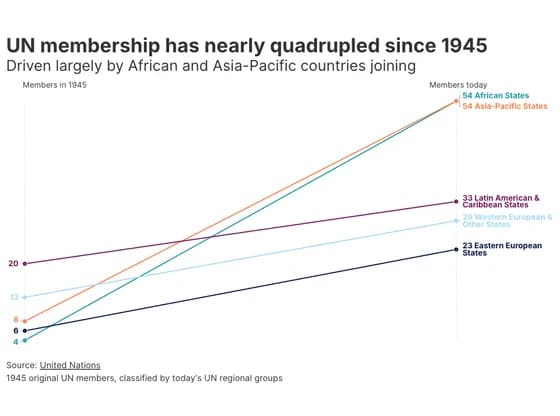 Slope chartUN membership has nearly quadrupled since 1945
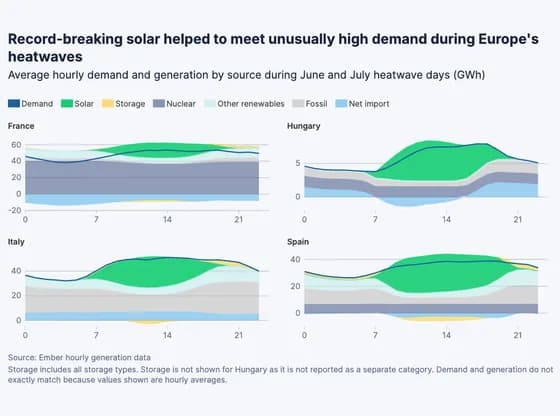 Line, bar and pie chartsRecord-breaking solar helped to meet unusually high demand during Europe's heatwaves
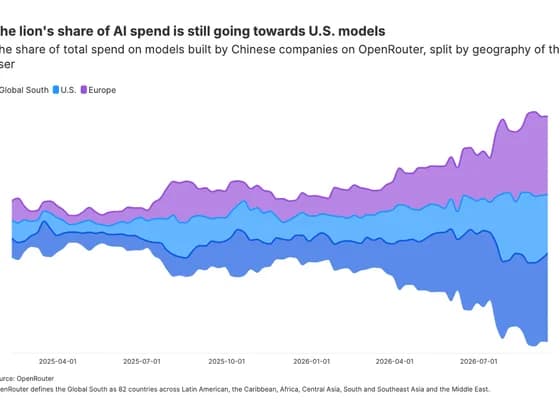 Line, bar and pie chartsThe lion's share of AI spend is still going towards U.S. models
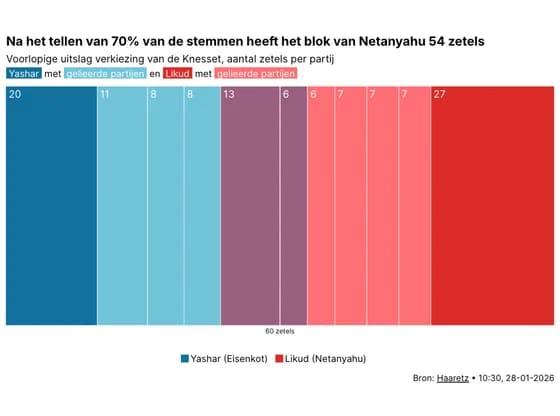 Elections and parliamentsNa het tellen van 70% van de stemmen heeft het blok van Netanyahu 54 zetels
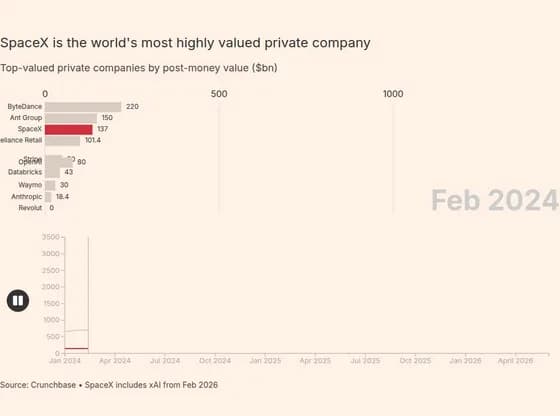 Animated chartsSpaceX is the world's most highly valued private company
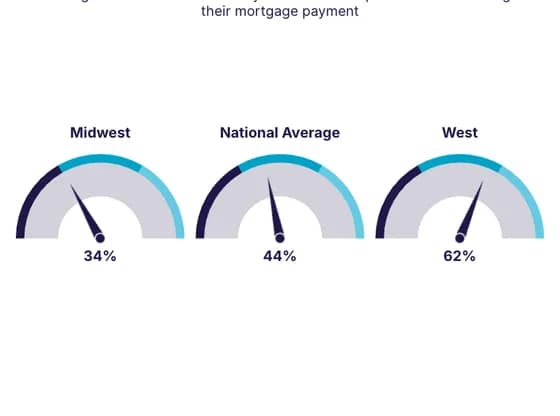 Counters and gaugesWhen Insurance Rivals the Mortgage
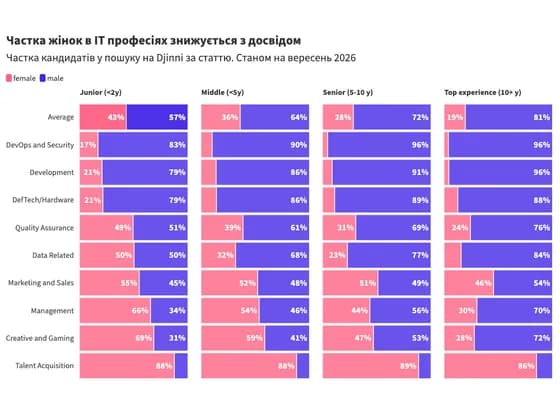 Line, bar and pie chartsЧастка жінок в IT професіях знижується з досвідом
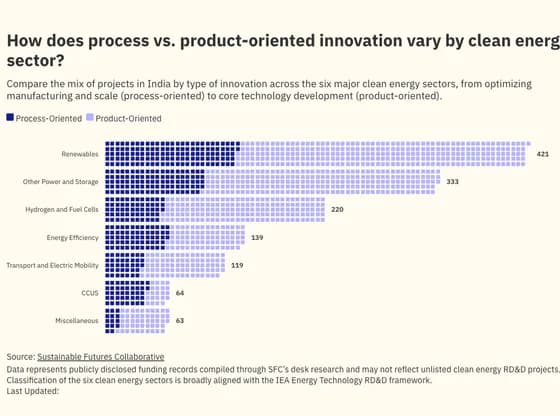 PictogramHow does process vs. product-oriented innovation vary by clean energy sector?
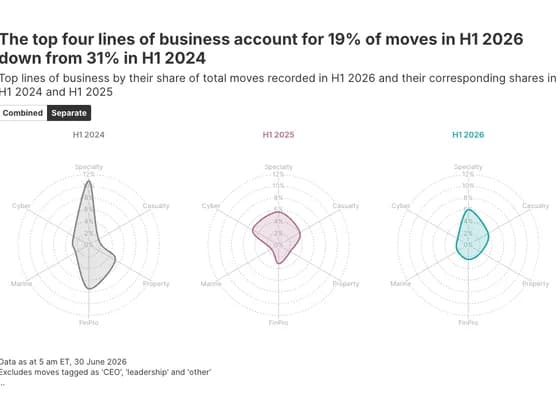 Radar chartThe top four lines of business account for 19% of moves in H1 2026 down from 31% in H1 2024
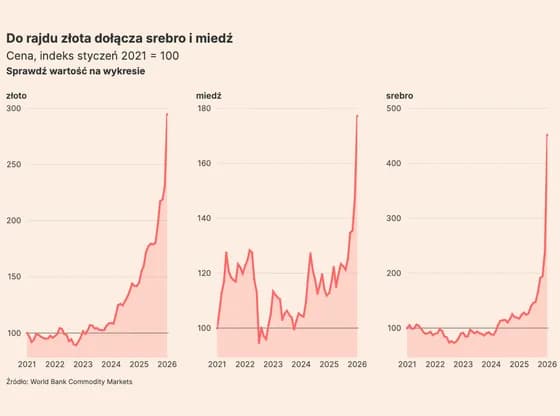 Line, bar and pie chartsDo rajdu złota dołącza srebro i miedź
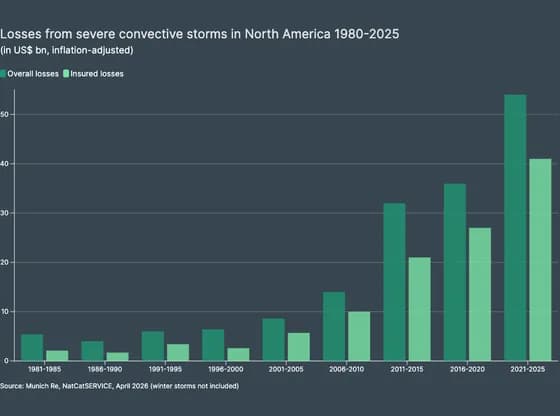 Line, bar and pie chartsLosses from severe convective storms in North America 1980-2025
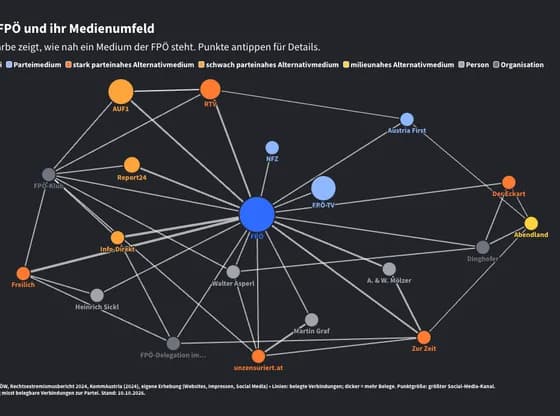 Network graphDie FPÖ und ihr Medienumfeld
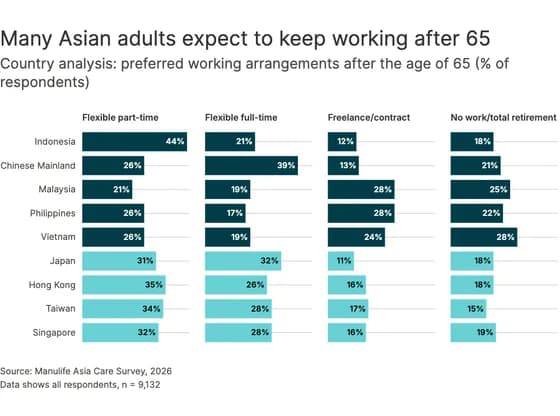 Line, bar and pie chartsMany Asian adults expect to keep working after 65
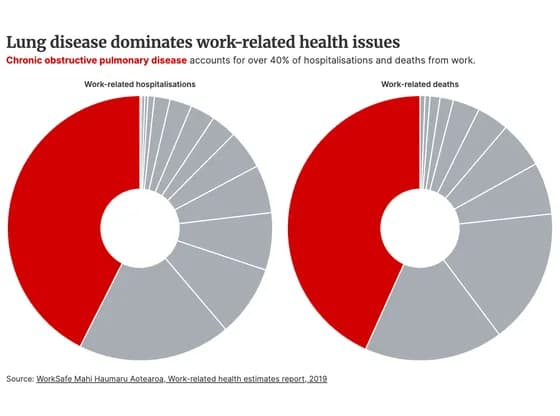 Line, bar and pie chartsLung disease dominates work-related health issues
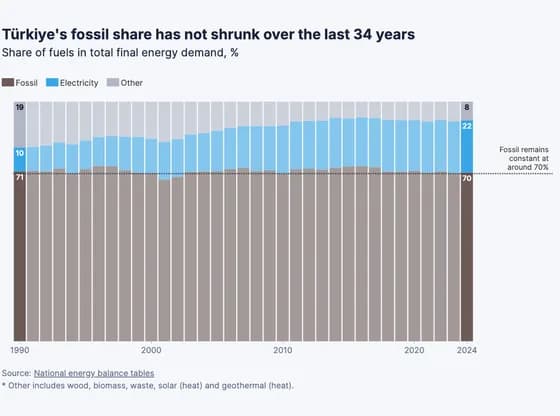 Line, bar and pie chartsTürkiye's fossil share has not shrunk over the last 34 years
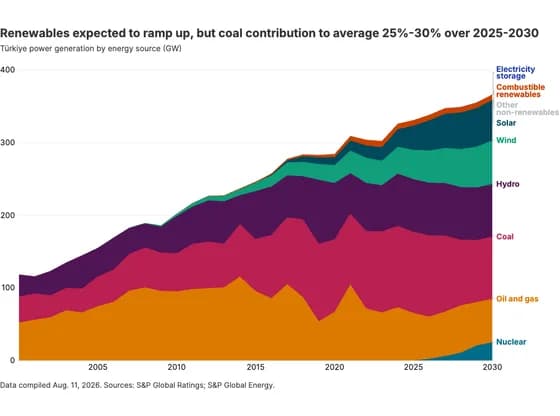 Line, bar and pie chartsRenewables expected to ramp up, but coal contribution to average 25%-30% over 2025-2030