
Chaque graphique ici a commencé dans un tableur.
Cartes, bar chart races, treemaps, pictogrammes et plus. Ouvrez-en un et refaites-le avec vos données.
 Interactive toolsDraw the line chart
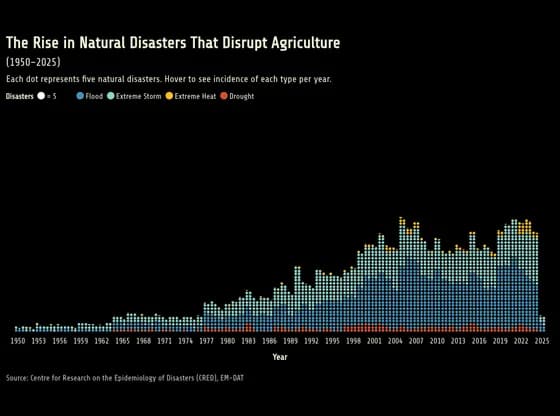 PictogramThe Rise in Natural Disasters That Disrupt Agriculture
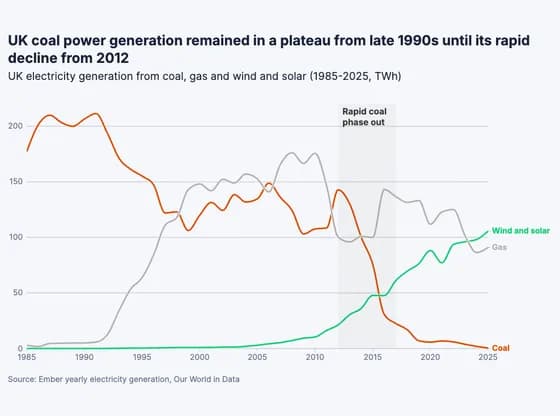 Line, bar and pie chartsUK coal power generation remained in a plateau from late 1990s until its rapid decline from 2012
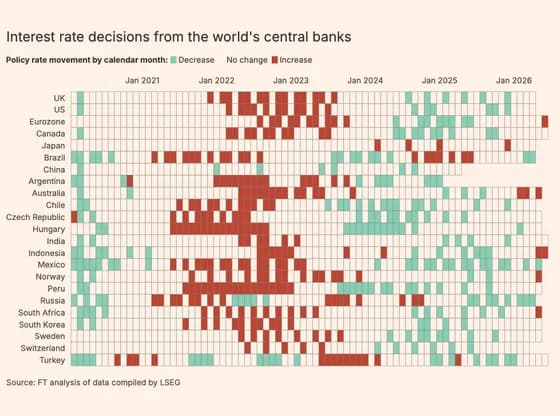 HeatmapInterest rate decisions from the world's central banks
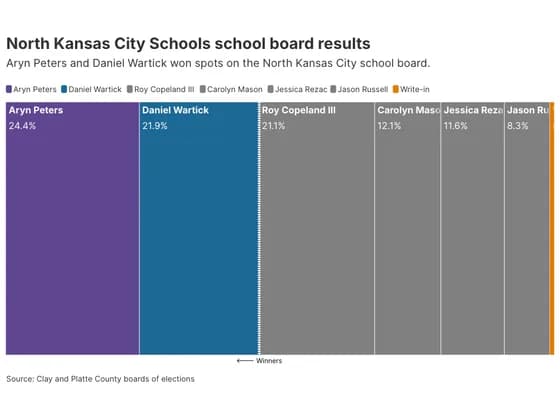 Elections and parliamentsNorth Kansas City Schools school board results
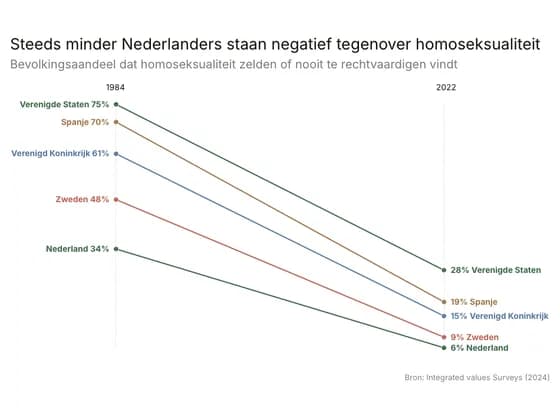 Slope chartSteeds minder Nederlanders staan negatief tegenover homoseksualiteit
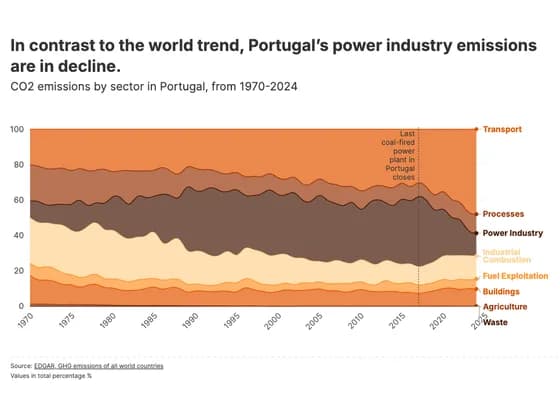 Line, bar and pie chartsIn contrast to the world trend, Portugal’s power industry emissions are in decline.
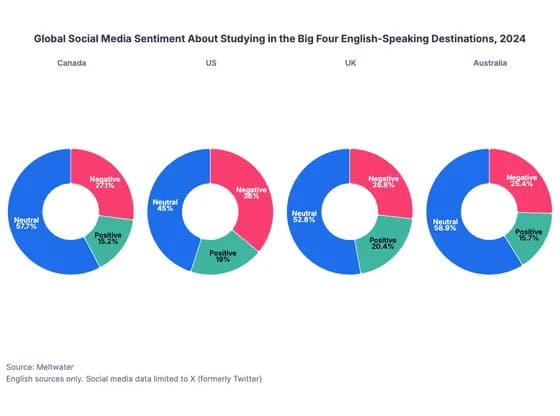 Line, bar and pie chartsGlobal Social Media Sentiment About Studying in the Big Four English-Speaking Destinations, 2024
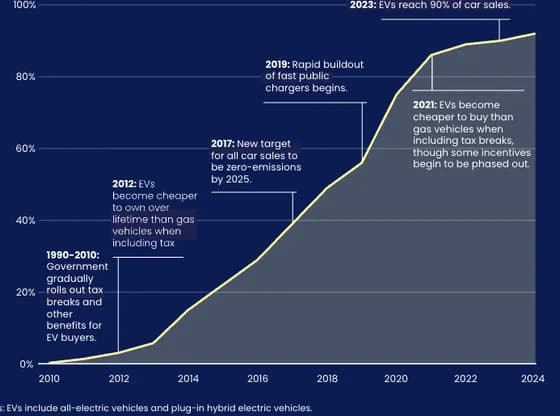 Interactive SVGNorway was the world's earliest EV champion
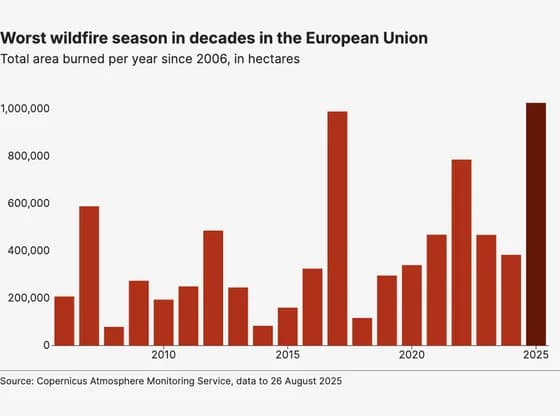 Line, bar and pie chartsWorst wildfire season in decades in the European Union
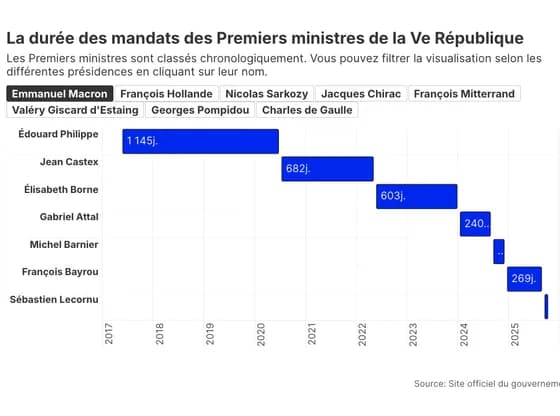 Gantt chartLa durée des mandats des Premiers ministres de la Ve République
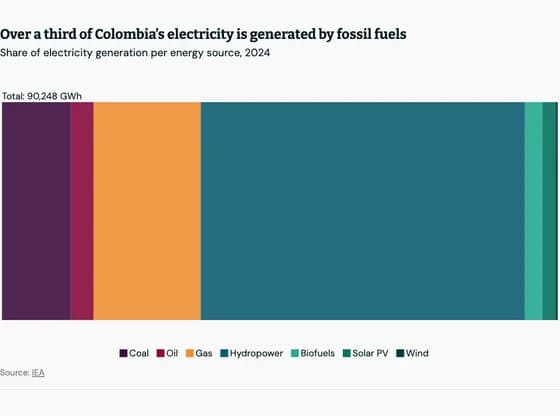 Line, bar and pie chartsOver a third of Colombia’s electricity is generated by fossil fuels
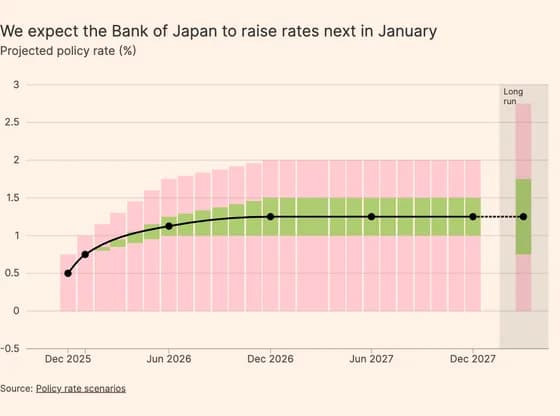 Line, bar and pie chartsWe expect the Bank of Japan to raise rates next in January
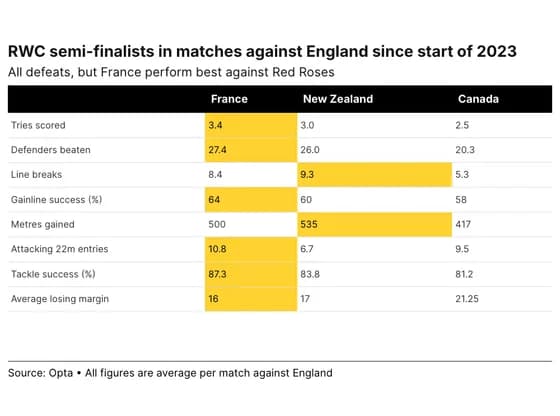 TableRWC semi-finalists in matches against England since start of 2023
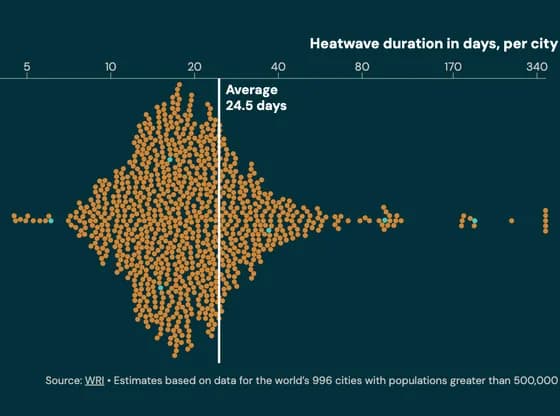 ScatterHeatwave duration in days, per city
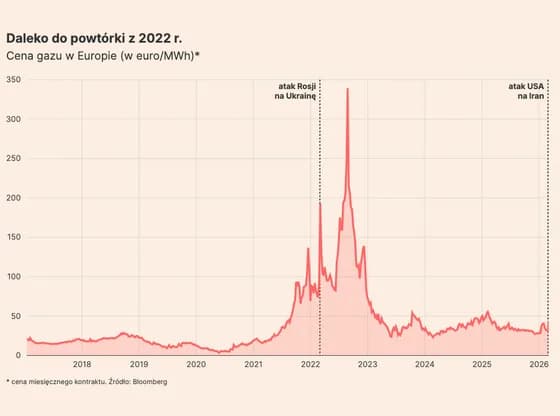 Line, bar and pie chartsDaleko do powtórki z 2022 r.
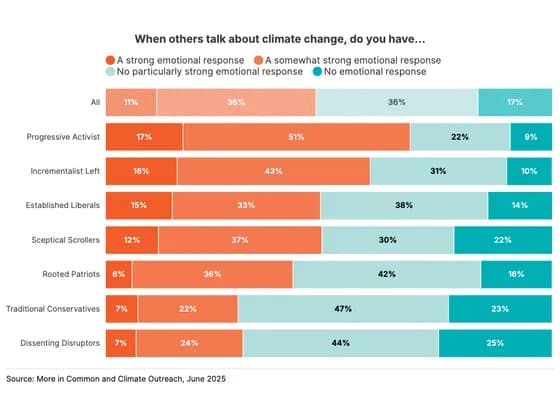 Line, bar and pie chartsWhen others talk about climate change, do you have...
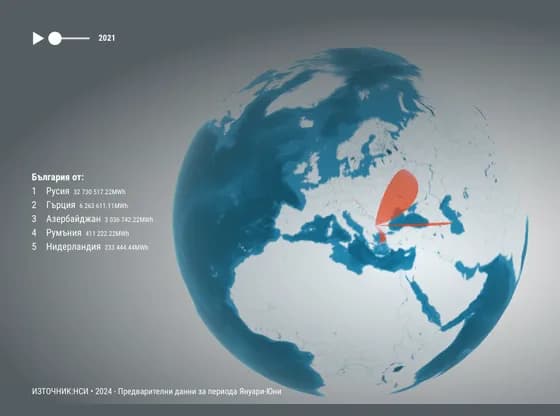 Connections and flow mapsCopy of Copy of Внос на природен газ по страна-партньор
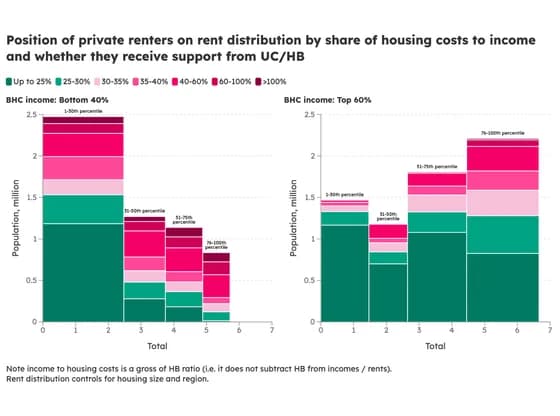 MarimekkoPosition of private renters on rent distribution by share of housing costs to income and whether…
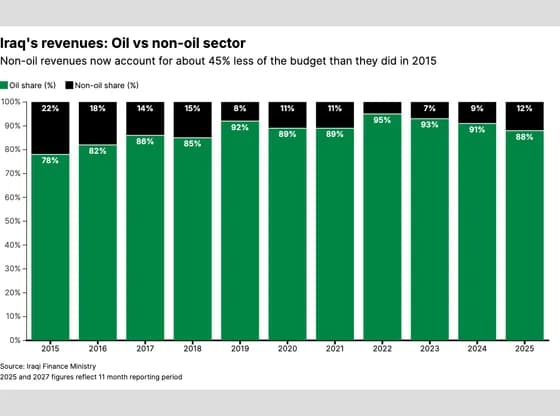 Line, bar and pie chartsIraq's revenues: Oil vs non-oil sector