
Chaque graphique ici a commencé dans un tableur.
Cartes, bar chart races, treemaps, pictogrammes et plus. Ouvrez-en un et refaites-le avec vos données.
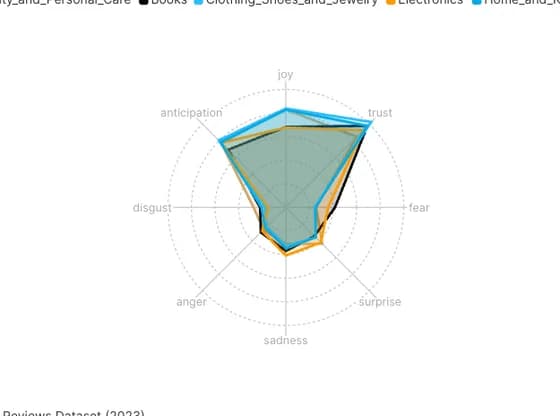 Radar chartSentiment & Emotion Radar: How Amazon Shoppers Reacted in 2023
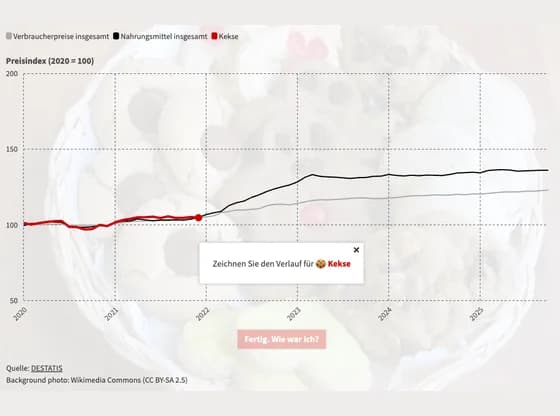 Interactive toolsKekse Preise zum Raten
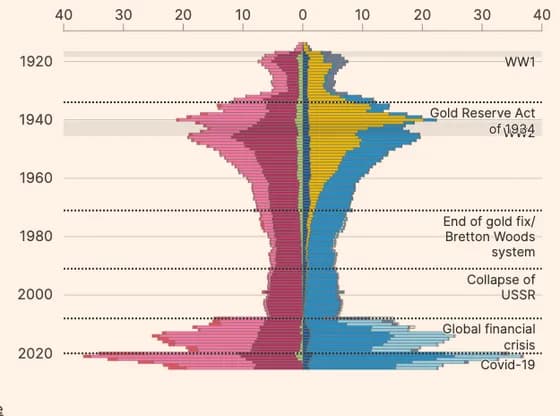 Line, bar and pie chartsA century of Fed balance sheets
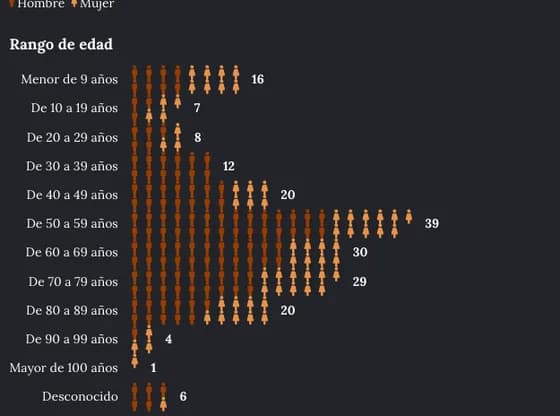 PictogramMiasis en humanos por gusano barrenador por edad
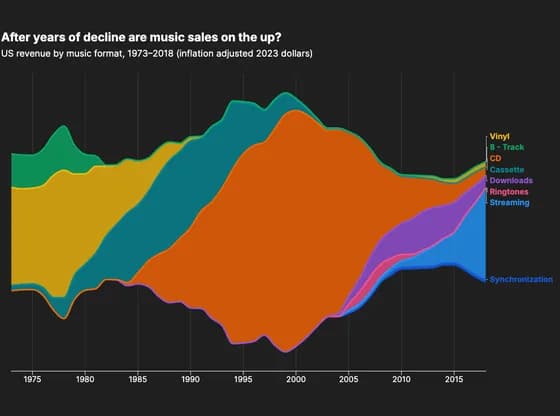 Line, bar and pie chartsAfter years of decline are music sales on the up?
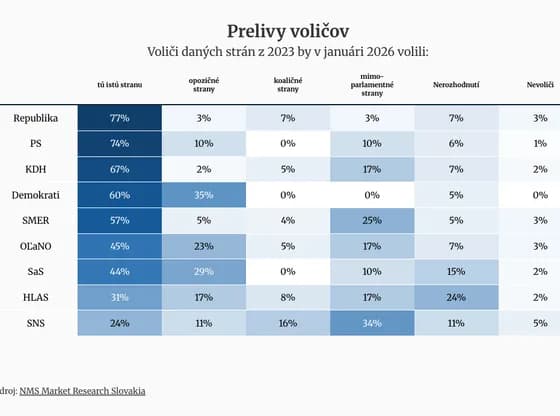 TablePrelivy voličov
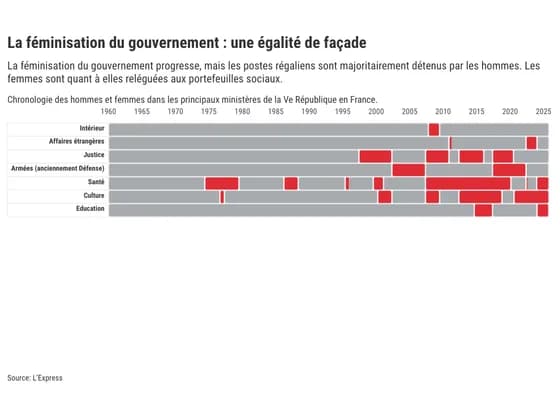 Gantt chartLa féminisation du gouvernement : une égalité de façade
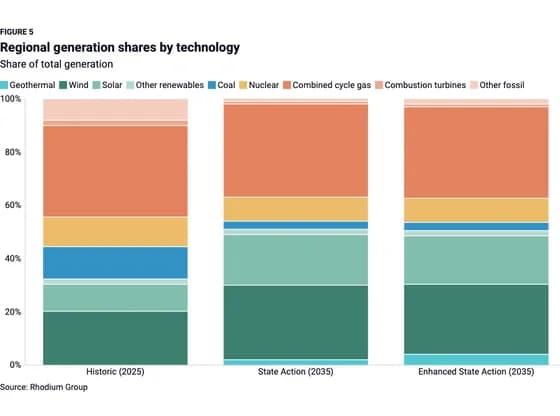 Line, bar and pie chartsFIGURE 5 Regional generation shares by technology
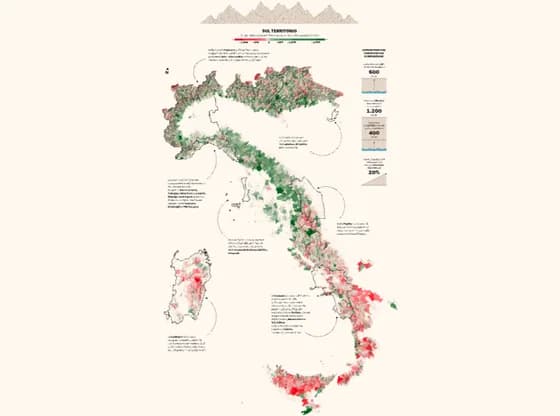 Interactive SVGCOMUNITA_MONTANE
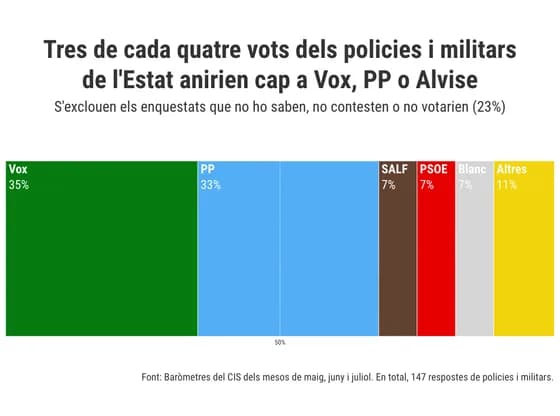 Elections and parliamentsTres de cada quatre vots dels policies i militars de l'Estat anirien cap a Vox, PP o Alvise
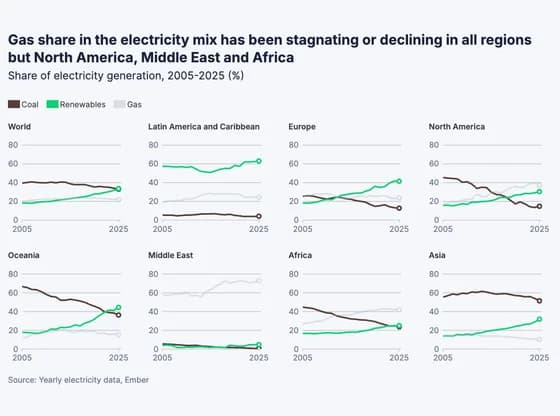 Line, bar and pie chartsGas share in the electricity mix has been stagnating or declining in all regions but North…
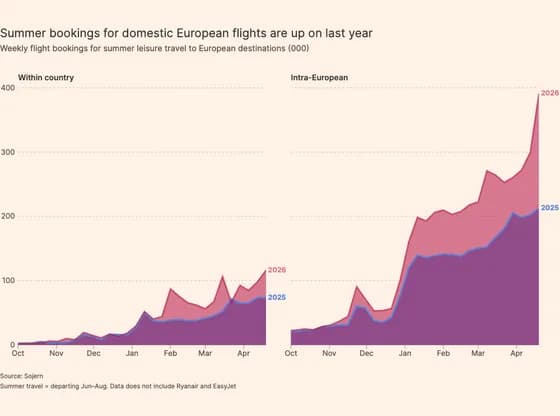 Line, bar and pie chartsSummer bookings for domestic European flights are up on last year
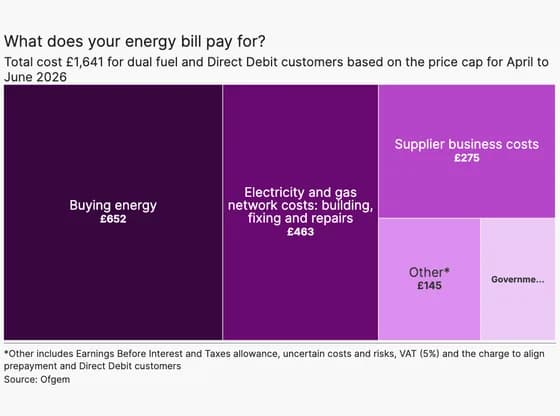 HierarchyWhat does your energy bill pay for?
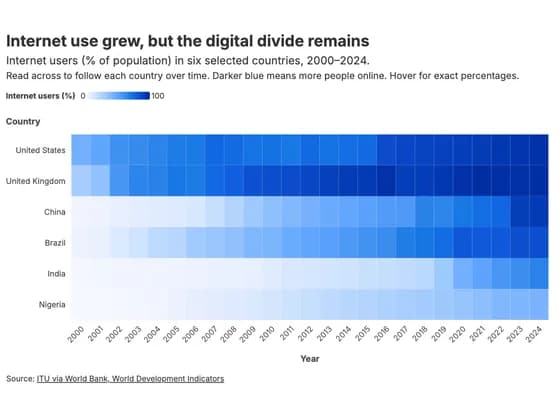 HeatmapInternet use grew, but the digital divide remains
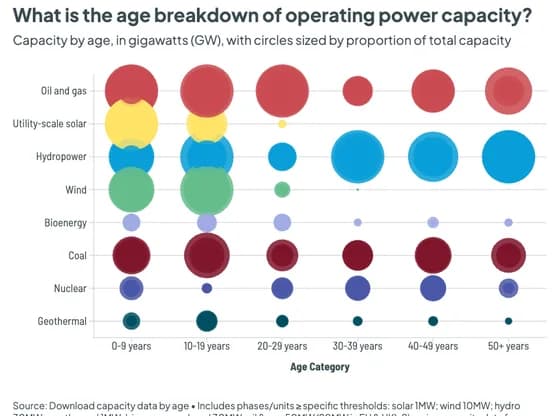 ScatterWhat is the age breakdown of operating power capacity?
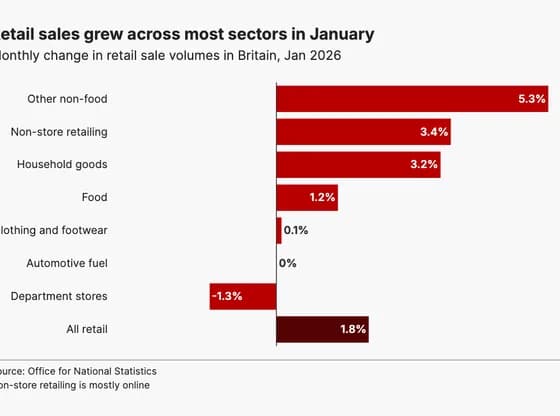 Line, bar and pie chartsRetail sales grew across most sectors in January
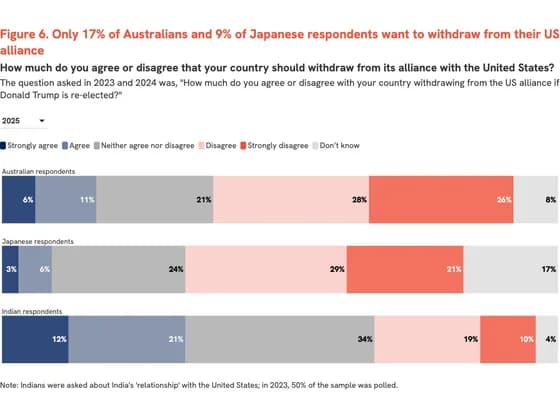 Line, bar and pie chartsFigure 6. Only 17% of Australians and 9% of Japanese respondents want to withdraw from their US…
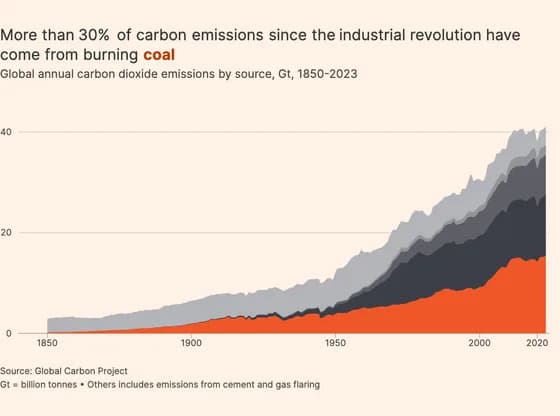 Line, bar and pie chartsMore than 30% of carbon emissions since the industrial revolution have come from burning coal
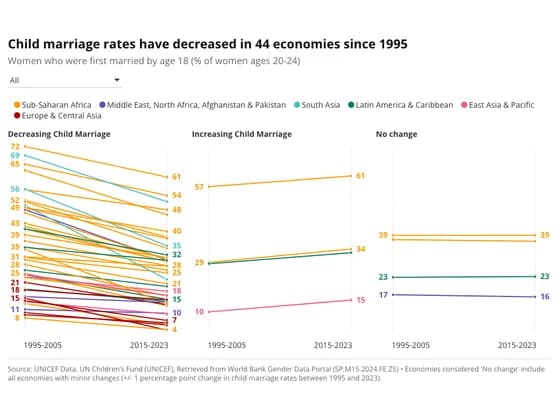 Slope chartChild marriage rates have decreased in 44 economies since 1995
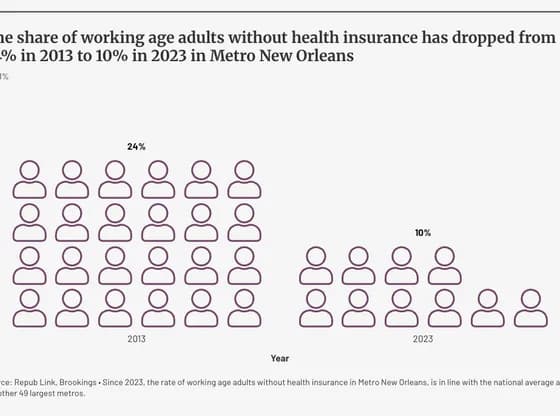 PictogramThe share of working age adults without health insurance has dropped from 24% in 2013 to 10% in…