
Chaque graphique ici a commencé dans un tableur.
Cartes, bar chart races, treemaps, pictogrammes et plus. Ouvrez-en un et refaites-le avec vos données.
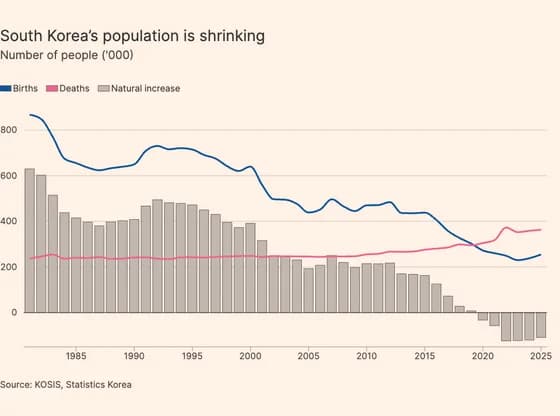 Line, bar and pie chartsSouth Korea’s population is shrinking
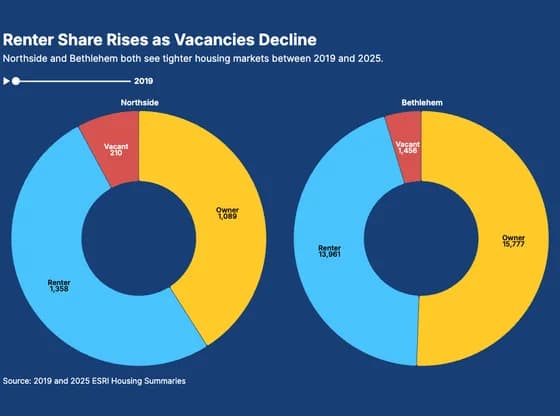 Line, bar and pie chartsRenter Share Rises as Vacancies Decline
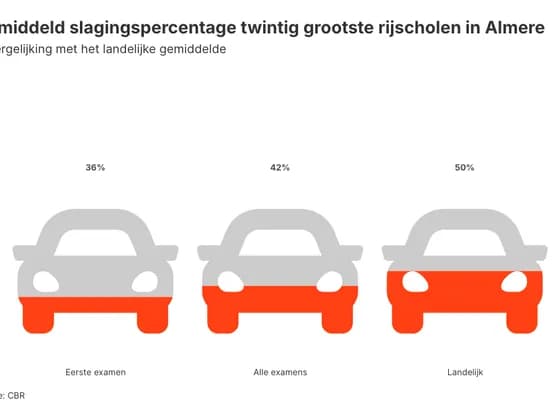 PictogramGemiddeld slagingspercentage twintig grootste rijscholen in Almere
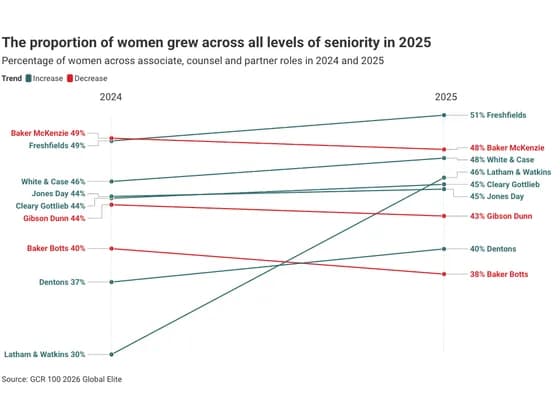 Slope chartThe proportion of women grew across all levels of seniority in 2025
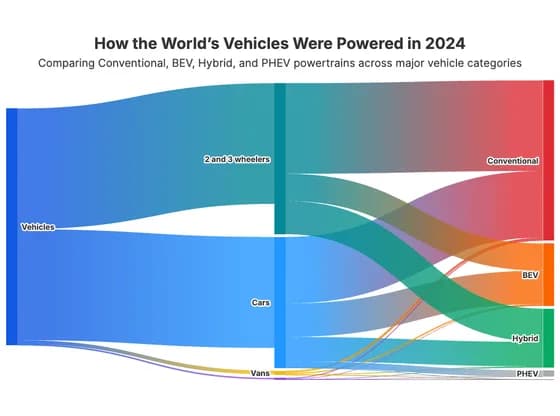 Sankey diagramHow the World’s Vehicles Were Powered in 2024
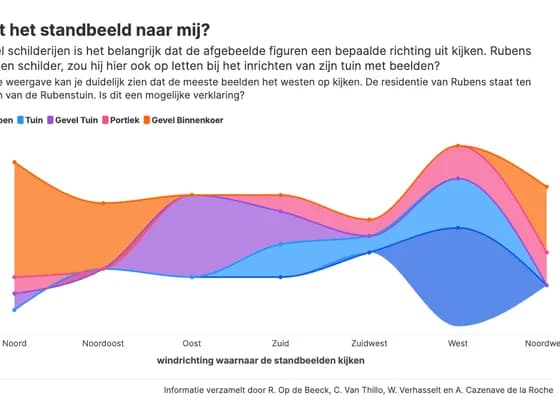 Line, bar and pie chartsKijkt het standbeeld naar mij?
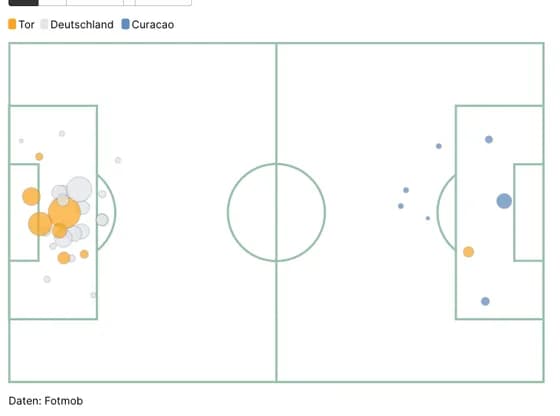 SportsDFB-Team Chancen vs Curacao
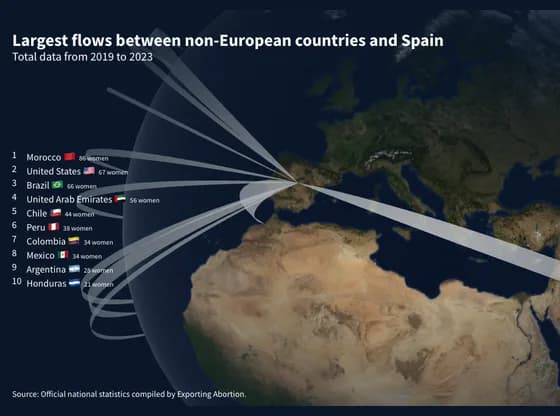 Connections and flow mapsLargest flows between non-European countries and Spain
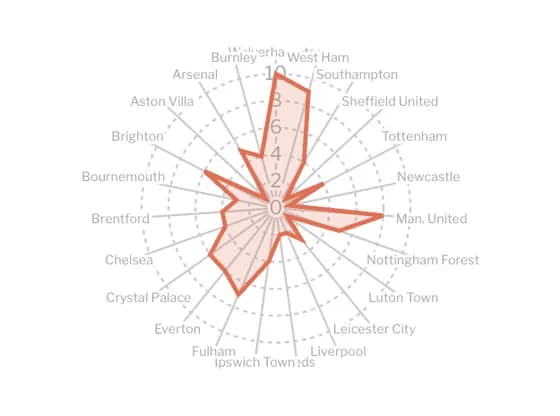 Radar chartDe 100 goals van Haaland tegen andere Premier League-ploegen
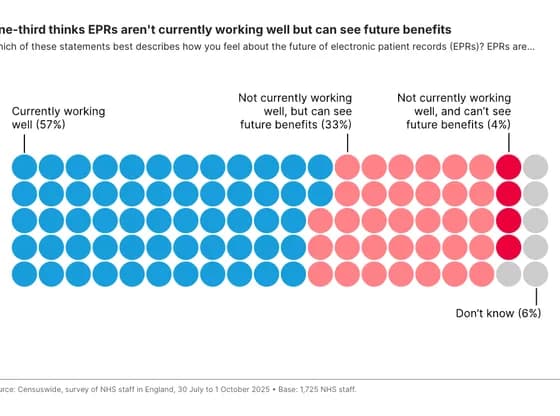 Interactive SVGOne-third thinks EPRs aren't currently working well but can see future benefits
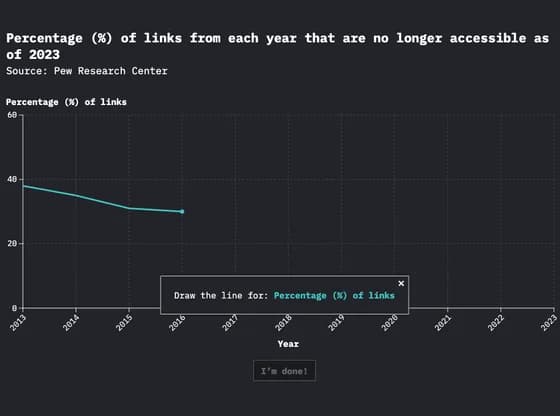 Interactive toolsPercentage (%) of links from each year that are no longer accessible as of 2023
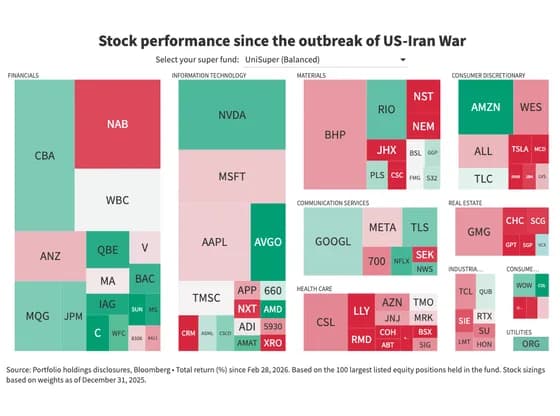 HierarchyStock performance since the outbreak of US-Iran War
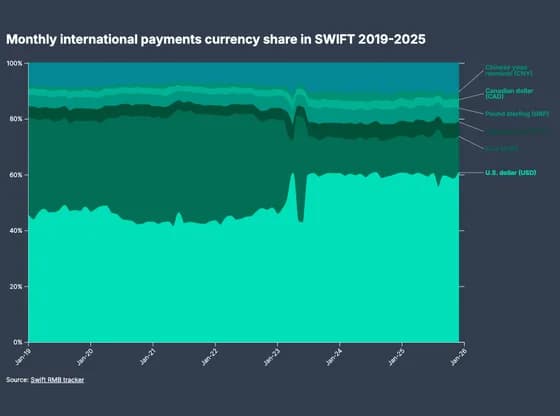 Line, bar and pie chartsMonthly international payments currency share in SWIFT 2019-2025
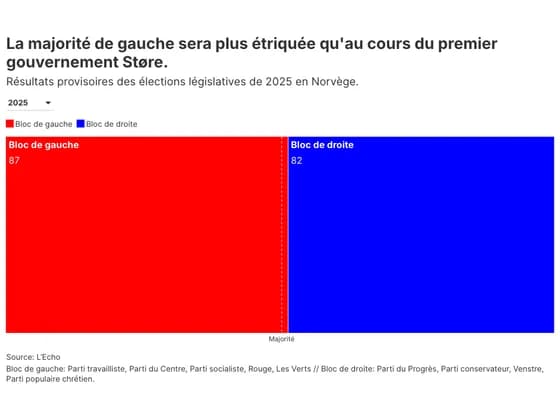 Elections and parliamentsLa majorité de gauche sera plus étriquée qu'au cours du premier gouvernement Støre.
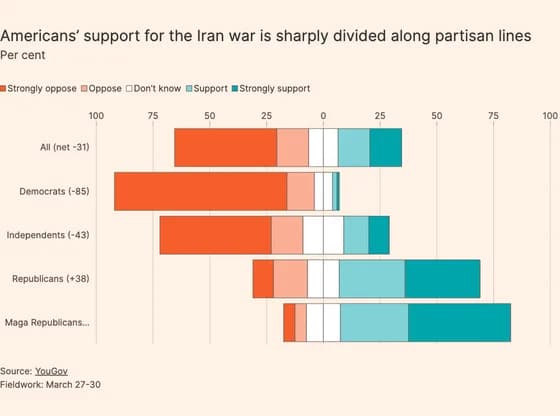 Line, bar and pie chartsAmericans’ support for the Iran war is sharply divided along partisan lines
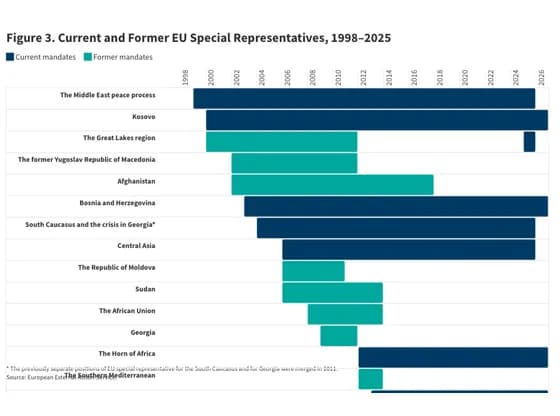 Gantt chartFigure 3. Current and Former EU Special Representatives, 1998–2025
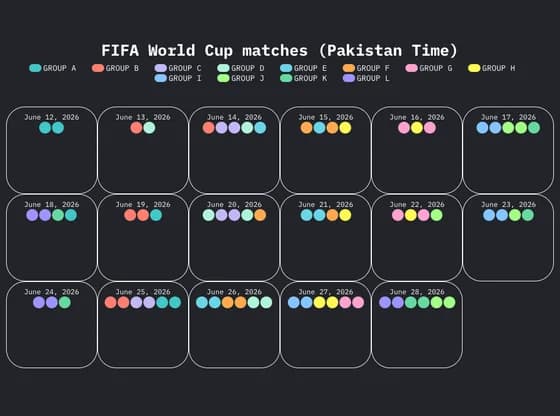 3D plotsFIFA World Cup matches (Pakistan Time)
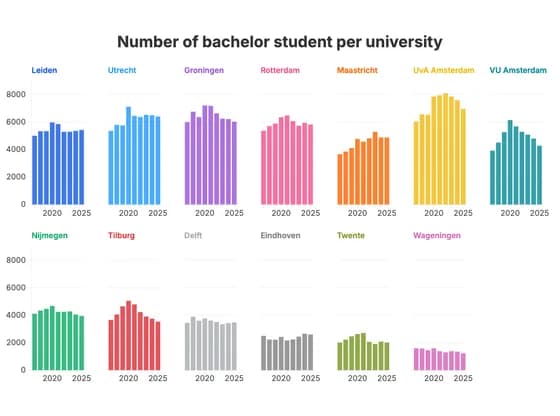 Line, bar and pie chartsNumber of bachelor student per university
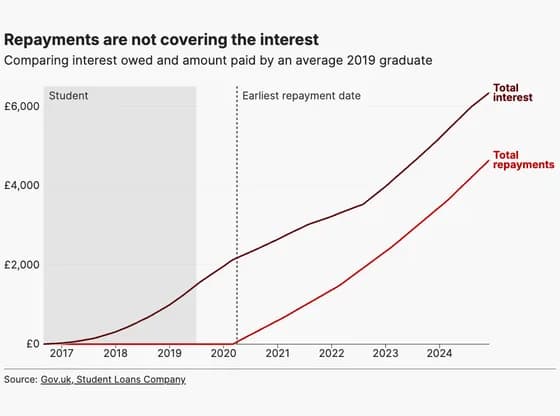 Line, bar and pie chartsRepayments are not covering the interest
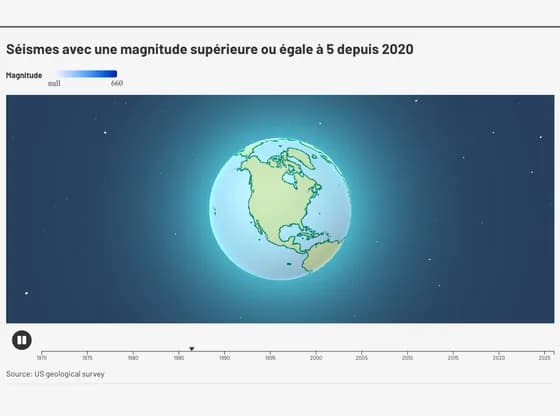 3D globeSéismes avec une magnitude supérieure ou égale à 5 depuis 2020