
Chaque graphique ici a commencé dans un tableur.
Cartes, bar chart races, treemaps, pictogrammes et plus. Ouvrez-en un et refaites-le avec vos données.
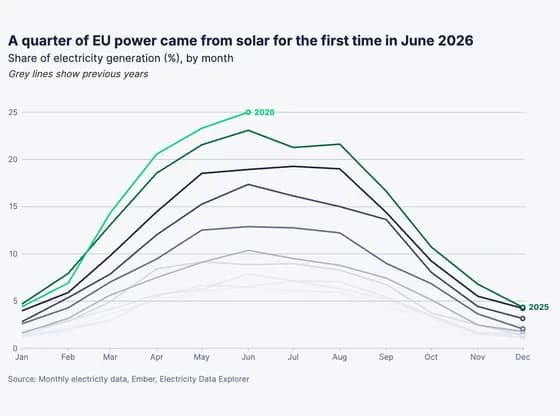 Line, bar and pie chartsA quarter of EU power came from solar for the first time in June 2026
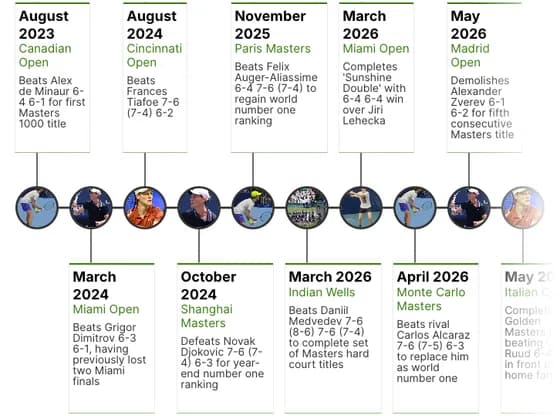 TimelineSinner's Golden Masters timeline
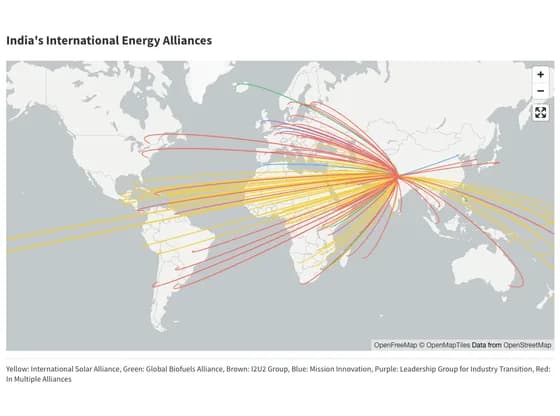 3D mapIndia's International Energy Alliances
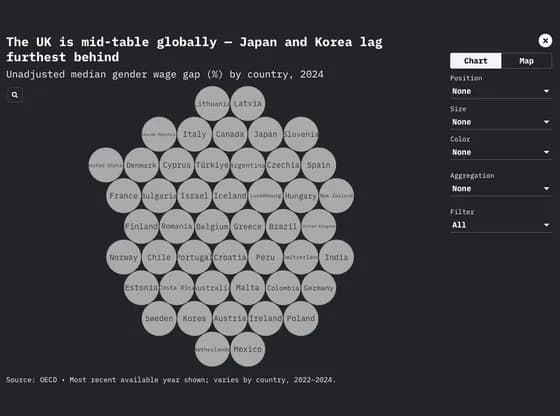 Interactive toolsThe UK is mid-table globally — Japan and Korea lag furthest behind
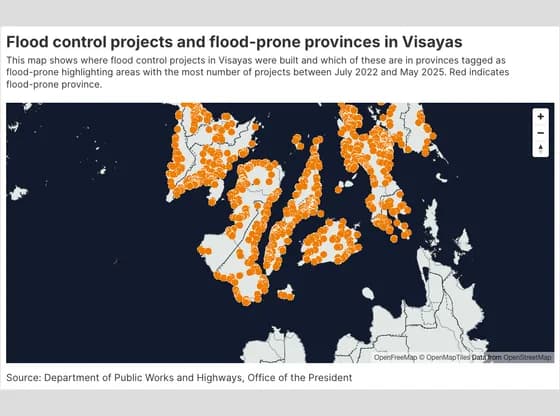 3D mapFlood control projects and flood-prone provinces in Visayas
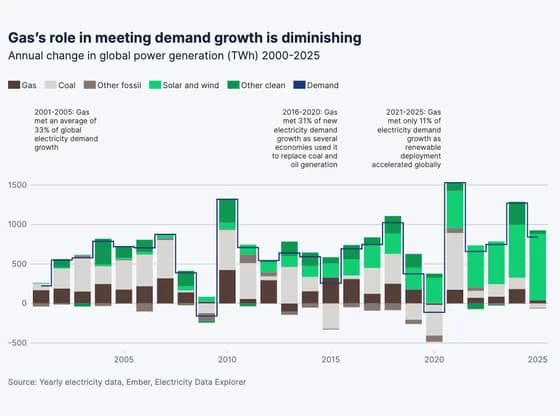 Line, bar and pie chartsGas’s role in meeting demand growth is diminishing
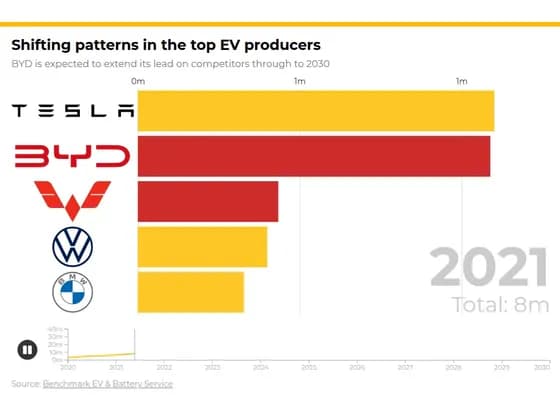 Animated chartsShifting patterns in the top EV producers
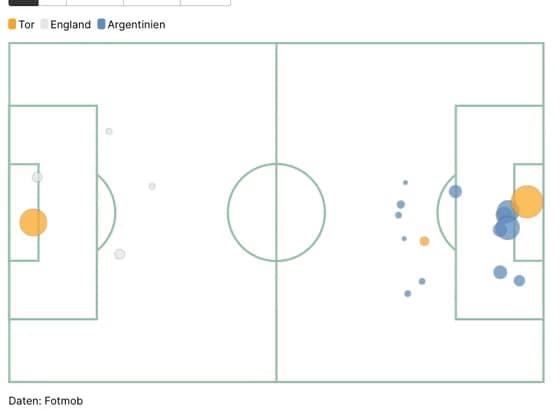 SportsArgentinien Chancen vs England
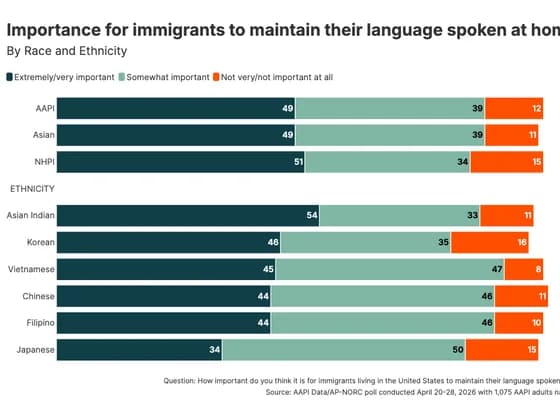 Line, bar and pie chartsImportance for immigrants to maintain their language spoken at home
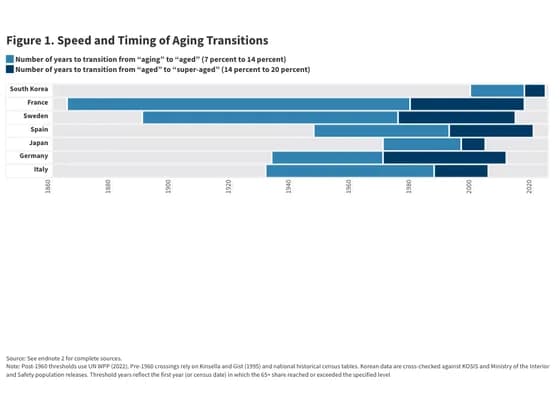 Gantt chartFigure 1. Speed and Timing of Aging Transitions
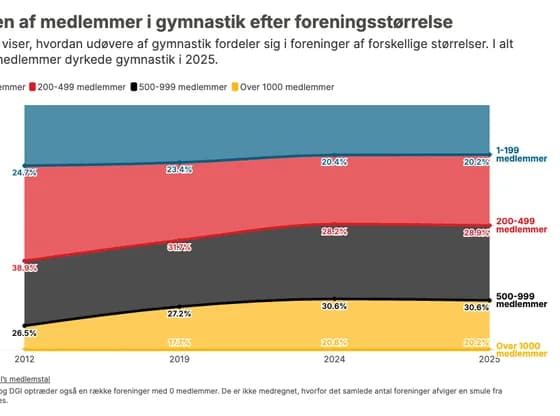 Line, bar and pie chartsAndelen af medlemmer i gymnastik efter foreningsstørrelse
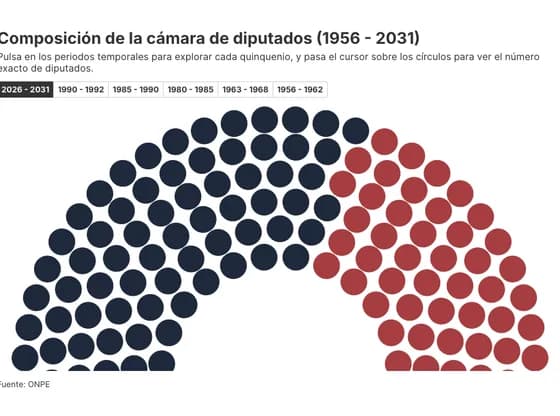 Elections and parliamentsComposición de la cámara de diputados (1956 - 2031)
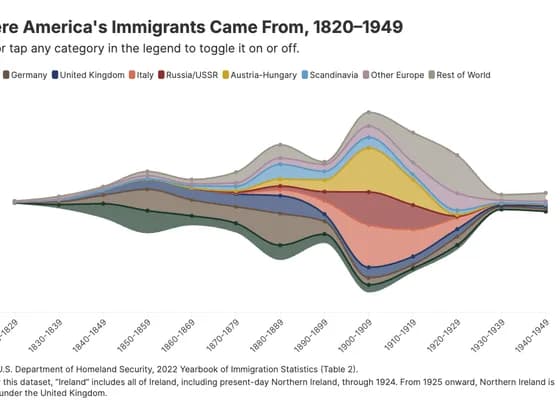 Line, bar and pie chartsWhere America's Immigrants Came From, 1820–1949
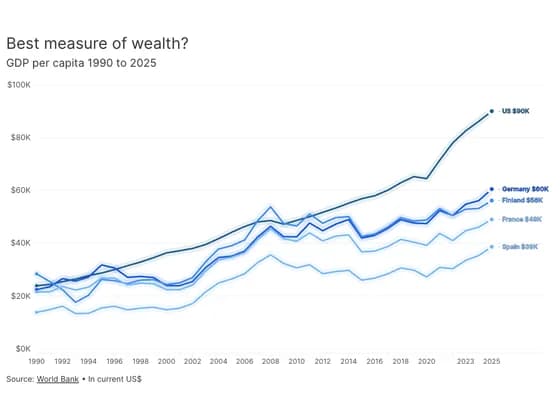 Animated chartsBest measure of wealth?
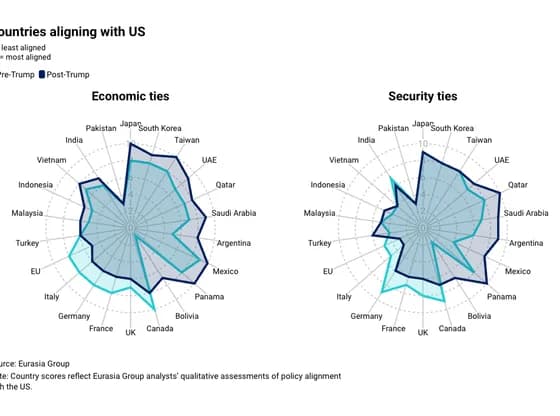 Radar chartCountries aligning with US
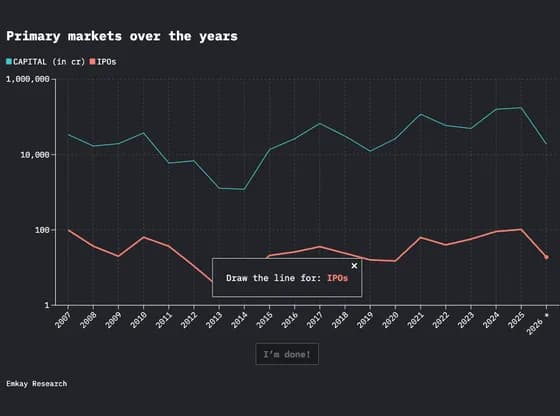 Interactive toolsPrimary markets over the years
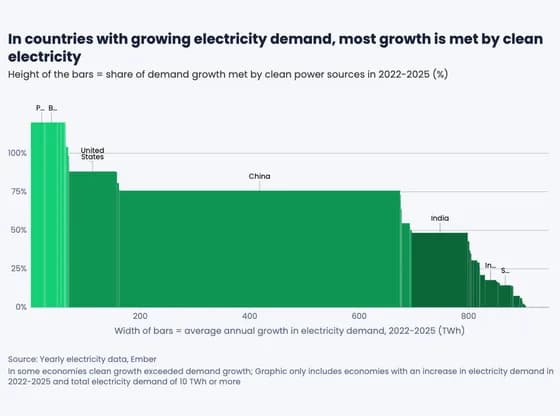 MarimekkoIn countries with growing electricity demand, most growth is met by clean electricity
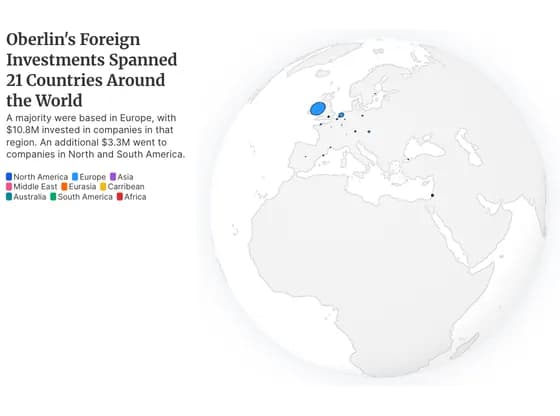 3D globeOberlin's Foreign Investments Spanned 21 Countries Around the World
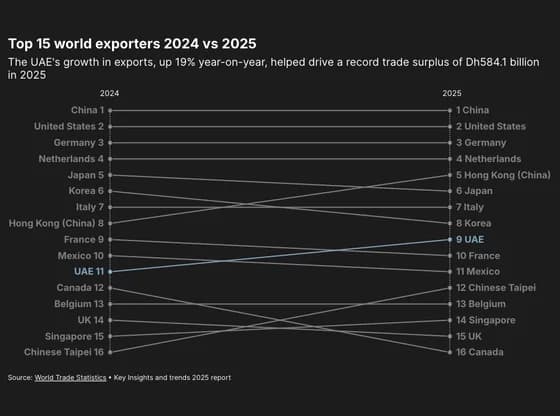 Slope chartTop 15 world exporters 2024 vs 2025
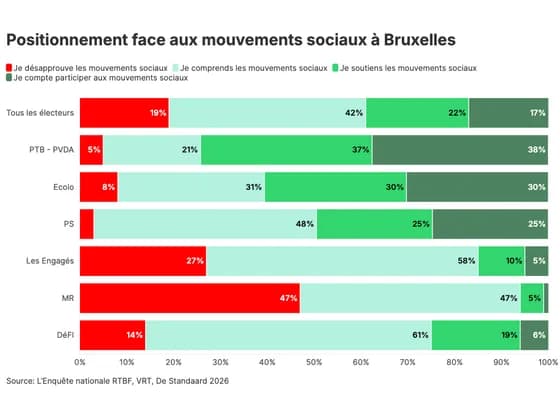 Line, bar and pie chartsPositionnement face aux mouvements sociaux à Bruxelles