
CSV de ejemplo
| Stage | Count |
|---|---|
| Visited Pricing Page | 18400 |
| Started Trial | 4120 |
| Activated Account | 2380 |
| Added Payment Method | 910 |
| Became Paying Customer | 640 |
A step by step walkthrough for turning a stage-by-stage spreadsheet into a published funnel chart in PlotSet, from ordering the rows to exporting or embedding the result.
Unos 7 minutosApplicants to hires, visitors to purchasers, leads to closed deals: how to create a funnel chart in PlotSet works the same way regardless of which stage counts are narrowing. You will upload the sheet, get the stage order right, label the drop-off between bands, and either publish a live embed or export a static image for a deck.
If your data is already two columns, stage and count, in the right order, this takes about five minutes. Add a couple more if you need to reconcile counts that came from different reports, since a funnel only works when each stage is genuinely a subset of the one before it. Budget the seven minutes below and treat the rest as buffer for that cleanup.
Two columns, one row per stage, already sorted in process order: the stage name first, the count still remaining second. No totals row, one header row.
| Stage | Count |
|---|---|
| Visited Pricing Page | 18400 |
| Started Trial | 4120 |
| Activated Account | 2380 |
| Added Payment Method | 910 |
| Became Paying Customer | 640 |
Row order is chart order. PlotSet draws the bands top to bottom in the order they appear in the file, so sort your rows by process stage before uploading, not by count.
Every stage must be a subset of the one above it. If some paying customers never technically "started a trial" in your tracking, the counts will not nest cleanly and the chart will misrepresent the process. Fix the definitions in the source data first.
Keep it to three to six stages. Below three you just have a conversion rate, and past six the bands get too thin to label.
The count column must decrease (or stay flat) from row to row. A stage that goes back up usually means two different metrics got mixed into one column, for example a raw pageview count sitting above a deduplicated visitor count.
El camino exacto en PlotSet, desde una plantilla en blanco hasta el gráfico terminado.
From the PlotSet dashboard, start a new project and choose the Funnel Chart template. It loads with sample stages already bound to the columns, so you can see the two-column shape before touching your own file.

In your spreadsheet, put the first stage of the process in row one and work down to the last. This is the step people skip, and it is the one PlotSet has no way to guess for you: nothing about the numbers themselves tells the chart which stage came first.
Import a CSV or .xlsx file from the data panel, paste rows directly from a spreadsheet, or connect a Google Sheet if the counts get refreshed on a schedule and you want the chart to update with them.

Confirm which column feeds the stage labels and which feeds the band width. PlotSet usually gets this right from clear headers like "Stage" and "Count", but check it if your sheet carries extra columns it might have guessed wrong on.

Switch on the label option that shows the percentage carried over from the previous stage, not just the raw count at each one. The count alone tells you the size of each stage; the conversion percentage tells you where the process is actually losing people.
A single colour, darkening slightly from top to bottom, reads as one continuous process rather than a set of unrelated categories. Reserve a second, contrasting colour for the one stage you want the reader to notice, usually the biggest drop.
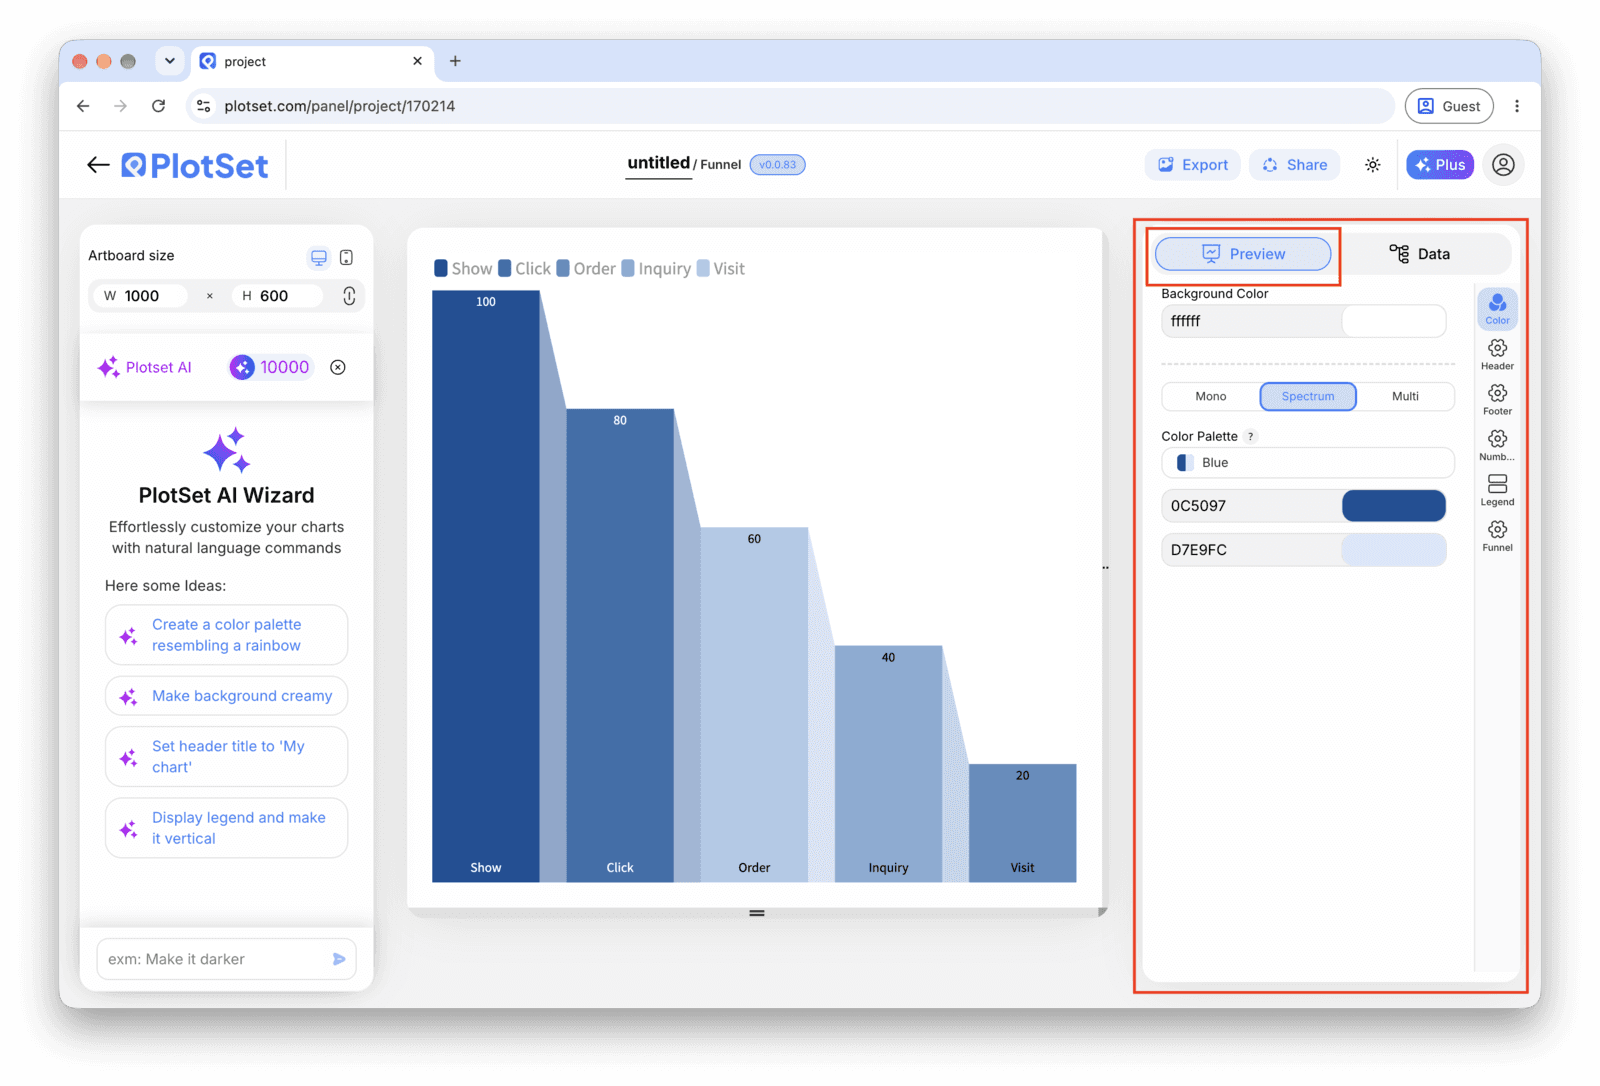
"Trial signup funnel" describes the data; "Most trials drop off before adding a payment method" states the finding. Put the second kind of title on the chart and let the bands back it up.
Publish for a live interactive chart where hovering a band shows its exact count and conversion rate, grab the embed code for a page, or export a PNG, SVG or PDF for a slide or report.
Empieza con la plantilla de Funnel Chart, que ya trae datos de ejemplo cargados, y sustitúyelos por los tuyos.
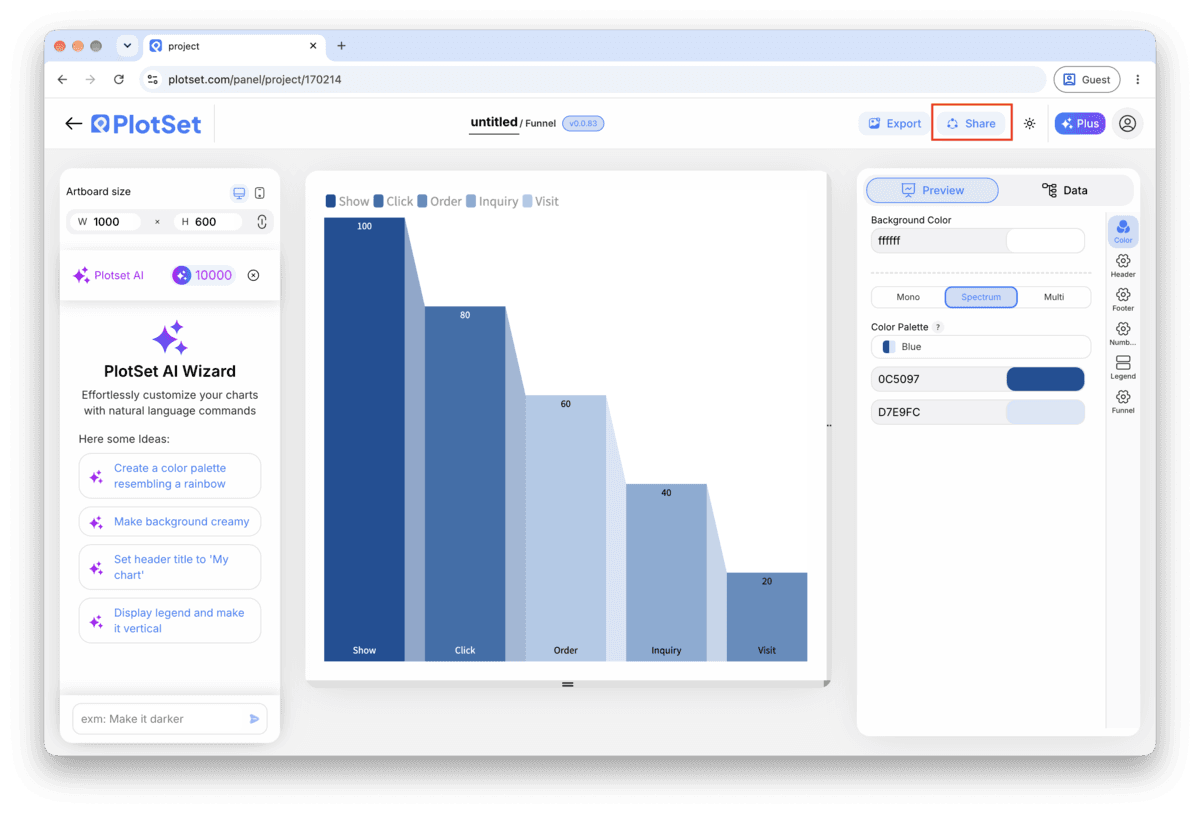
Abrir la plantillaEl último tramo es igual en todos los tipos de gráfico: Share convierte el gráfico en un enlace público en vivo y un código de incrustación, y Export lo guarda como un archivo estático.
Al activar el código de incrustación y el enlace público, el gráfico queda publicado. El enlace se lo puedes enviar a cualquiera sin problema, y el código de incrustación se coloca en cualquier página como un iframe que conserva los tooltips al pasar el cursor y toda la interactividad. Si editas el gráfico más adelante, haz clic en Recreate para llevar esos cambios a ambos.

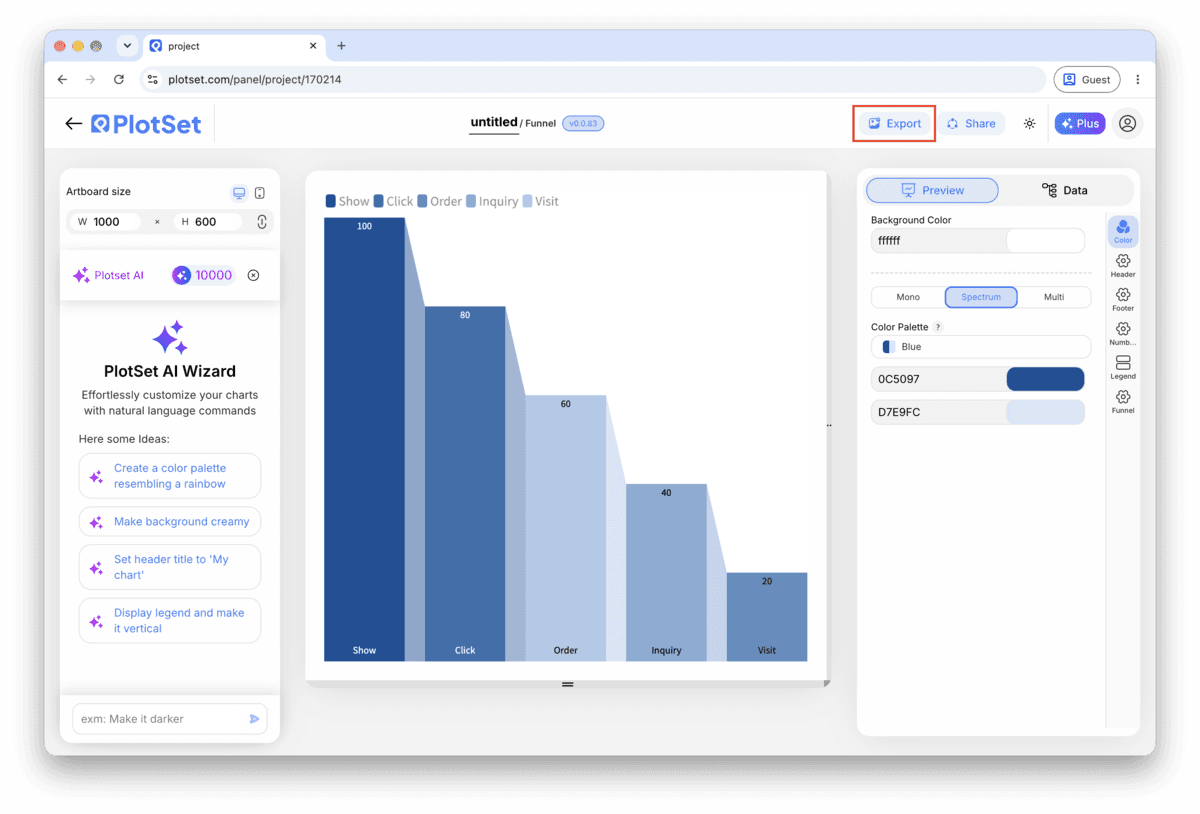
Export guarda una copia estática en el tamaño que necesites. El SVG se mantiene nítido a cualquier escala y se puede seguir editando en una herramienta de diseño; PNG y JPG son la opción segura para diapositivas y documentos. El multiplicador de escala es lo que te da una imagen nítida en una pantalla retina.

A funnel chart with only the count at each stage asks the reader to do subtraction in their head. Show the amount or percentage lost between consecutive stages directly on the taper, so the worst step is visible without any arithmetic.
Some tools offer a beveled or 3D-shaded funnel. It looks like a decoration from a slide template and makes the band widths harder to compare accurately. A flat funnel with straight taper edges reads faster and measures better.
It is tempting to sort by count when a report happens to come out that way, but a funnel's row order is read as "what happens first," not "what is largest." If two stages could ever swap order and still make sense, they do not belong in the same funnel.
A single hue that gets slightly darker toward the bottom mirrors the shrinking shape and needs no legend. Colouring bands by their count instead just repeats information the width already shows.
This almost always means the rows were sorted by count, alphabetically, or by whatever order they came out of a report, not by the order the stages happen in. Re-sort the source rows by process stage in the spreadsheet and re-upload; PlotSet renders top to bottom in row order and cannot infer the process for you.
A later stage cannot legitimately have more people than an earlier one in a true funnel, so this points to two different counting methods getting mixed together, for example a session count above a unique-user count. Check how each number was produced and make sure every stage counts the same population, just filtered further.
Past about six stages, minor sub-steps crowd out the ones that matter and every band gets too thin to label. Group the intermediate steps into the handful of stages someone could realistically act on, and move the finer breakdown into a table alongside the chart.
¿No estás seguro de que el Funnel Chart sea la opción correcta? Descubre qué es, cuándo usarlo y cuándo no.
Two columns and one header row, with the stage name in the first column and the count remaining at that stage in the second. Rows must already be sorted in process order, since PlotSet draws bands top to bottom in the order they appear in the file.
Gratis para empezar con más de 300 plantillas. No se necesita tarjeta de crédito.