
CSV de ejemplo
| Channel | Budget |
|---|---|
| Paid Search | 42000 |
| Social Ads | 31000 |
| 18500 | |
| Content | 12000 |
| Events | 9500 |
| Other | 6000 |
A step by step walkthrough for turning a spreadsheet into a published donut chart in PlotSet, from shaping the sheet to filling the centre hole and exporting or embedding the finished ring.
Unos 7 minutosA marketing budget split across five channels, paid search, social ads, email, content and events, with one honest "Other" row for the rest, is the working example for how to create a donut chart in PlotSet. By the end you'll have a published, interactive ring chart with the total budget sitting in the centre hole, built from your own categories, not a screenshot of someone else's.
If your spreadsheet is already two columns, category and value, this takes about seven minutes. Add a few more if you're pulling the numbers out of a wider report, or if you're still deciding what belongs in "Other". Budget the walkthrough below and treat the rest as buffer.
Two columns, one row per category: the category name first, its raw value second. No totals row, one header row, and categories that genuinely add up to the whole you're describing.
| Channel | Budget |
|---|---|
| Paid Search | 42000 |
| Social Ads | 31000 |
| 18500 | |
| Content | 12000 |
| Events | 9500 |
| Other | 6000 |
Keep the value column as raw numbers, not percentages you've already worked out. PlotSet calculates each segment's share of the total itself, so a percent sign in that column throws the math off.
Roll anything under a few percent of the total into a single "Other" row before you upload. Eight thin slivers read worse than one clearly labelled bucket.
Delete a totals row before uploading, the same rule as any summed chart. Uploaded as data, a "Total" row becomes its own segment, usually the biggest one on the ring.
Category names need to be unique. Two rows both labelled "Misc" or "Other" get merged or duplicated depending on your spreadsheet's export, so rename one before you upload.
El camino exacto en PlotSet, desde una plantilla en blanco hasta el gráfico terminado.
From the PlotSet dashboard, start a new project and pick the Donut Chart template. It loads with sample data already in place, so you can see the two-column shape it expects before touching your own file.

Category name in the first column, its number in the second, one row per category. If you're working from a pivot table, flatten it first: the upload should be nothing but categories and values, no subtotals mixed in.
Import a CSV or .xlsx from the data panel, paste rows straight from a spreadsheet, or connect a Google Sheet if you want the ring to refresh later without a re-upload. PlotSet reads the first row as headers automatically.

Confirm which column feeds the segment labels and which feeds the angles. PlotSet usually guesses right when your headers are clear, but check it manually if the sheet carries extra columns it might have picked up by mistake.

Sort largest to smallest so the eye has a path around the ring instead of hunting for it. Turn on percentage labels directly on each segment: angles alone are hard to judge, and the number removes the guesswork.
Set the centre text to the sum of your value column, not a default label PlotSet might have picked. This is the one thing a donut can do that a pie can't, so it's worth checking rather than leaving on auto.
Use shades of one hue for a ranked set of related categories, or distinct colours only when the categories are genuinely different things. Reserve a stand-out colour for the one segment you want to highlight. Give the chart a title that states what's being split, not just the word "budget".
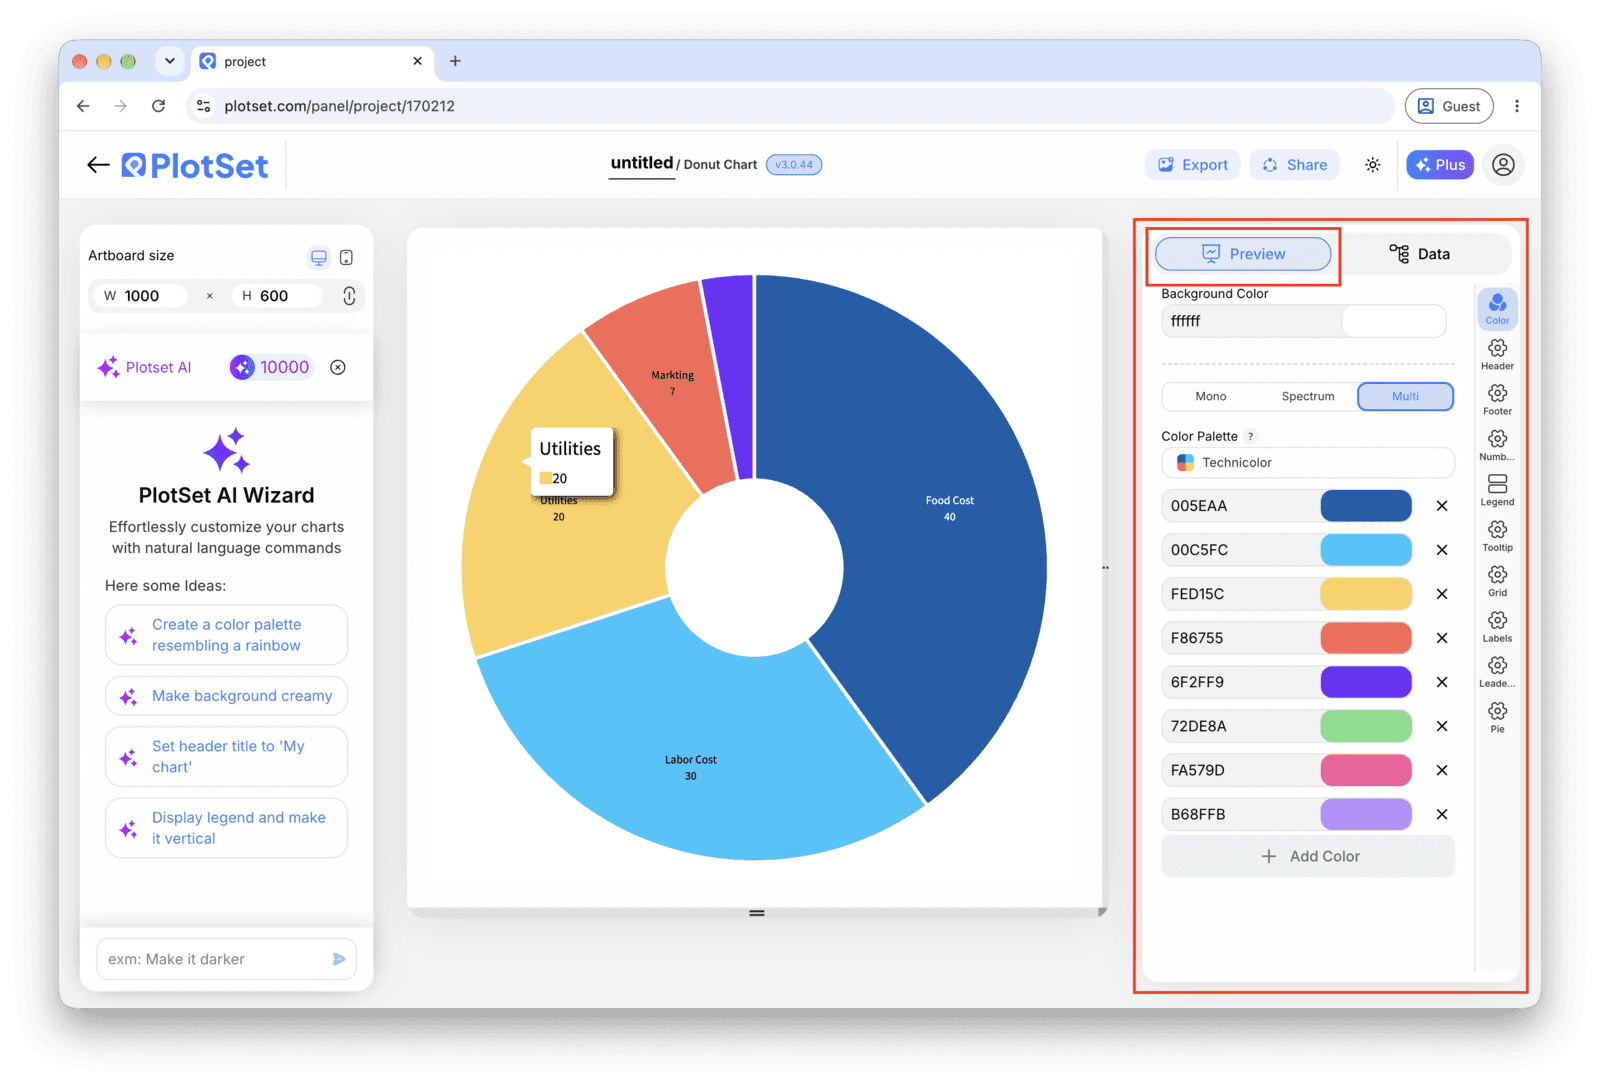
Publish for a live, interactive ring with hover tooltips and a shareable link, grab the embed code for a page, or export a PNG, SVG or PDF if you need a static image for a deck or report.
Empieza con la plantilla de Donut Chart, que ya trae datos de ejemplo cargados, y sustitúyelos por los tuyos.
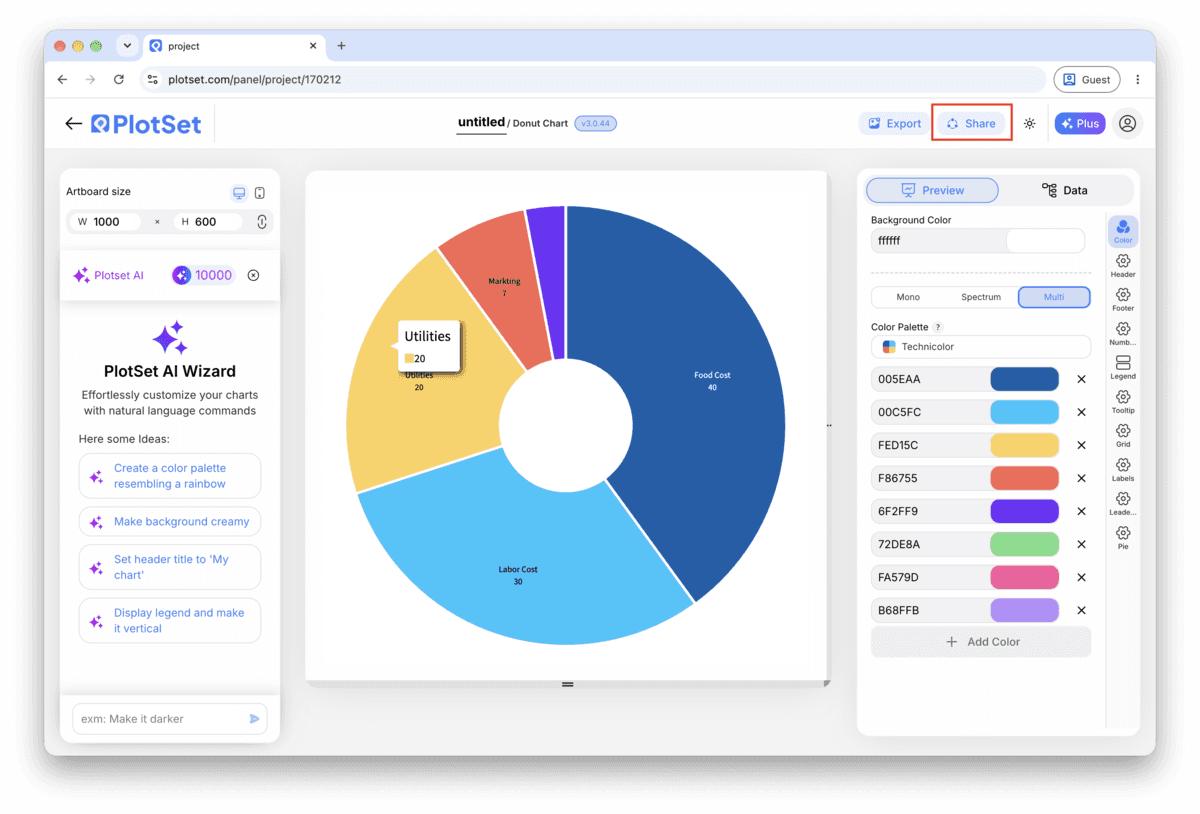
Abrir la plantillaEl último tramo es igual en todos los tipos de gráfico: Share convierte el gráfico en un enlace público en vivo y un código de incrustación, y Export lo guarda como un archivo estático.
Al activar el código de incrustación y el enlace público, el gráfico queda publicado. El enlace se lo puedes enviar a cualquiera sin problema, y el código de incrustación se coloca en cualquier página como un iframe que conserva los tooltips al pasar el cursor y toda la interactividad. Si editas el gráfico más adelante, haz clic en Recreate para llevar esos cambios a ambos.

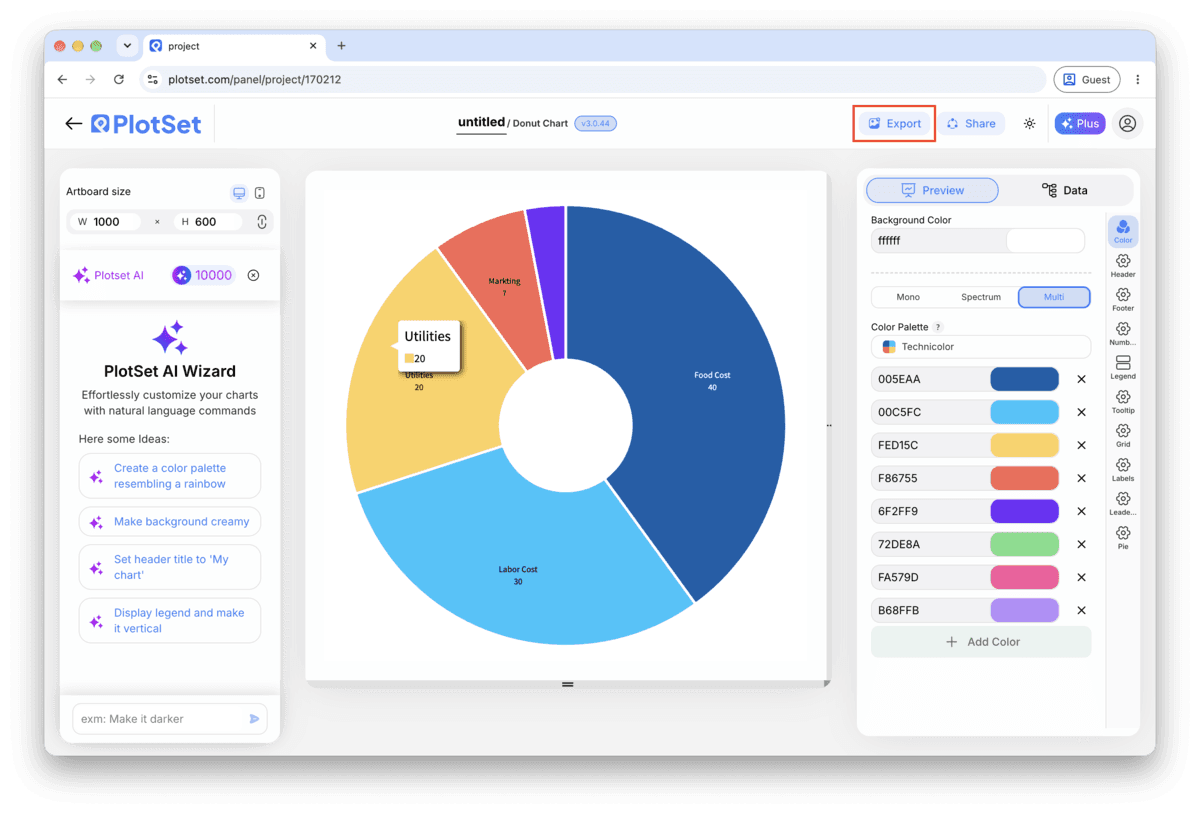
Export guarda una copia estática en el tamaño que necesites. El SVG se mantiene nítido a cualquier escala y se puede seguir editando en una herramienta de diseño; PNG y JPG son la opción segura para diapositivas y documentos. El multiplicador de escala es lo que te da una imagen nítida en una pantalla retina.

A thin ring with a cramped centre makes the total illegible and the segments hard to click. Widen the hole until the centre number sits comfortably on its own line, with a small caption underneath naming what it is.
With five categories or fewer, put the label and percentage right on or beside each arc and drop the separate legend. It removes the lookup step between colour and category entirely, which a legend never quite avoids.
For a ranked breakdown, ordering shades from darkest (largest share) to lightest (smallest) reinforces the sort visually. Save a genuinely different colour for a category you're calling out on purpose, like this year's new channel.
A centre total of $118,517.42 is precision nobody needs at a glance. Round to a sensible unit ($119K, or 42%) and let the data table underneath carry the exact figure for anyone who wants it.
This usually means two categories overlap, or one is a rate or an average rather than a slice of the same total. Check your source data for a row that doesn't belong to the same whole as the rest, and pull it into its own chart if it doesn't.
Below a few percent, a label has nowhere to sit without colliding with its neighbour. Roll those rows into a single "Other" category before upload rather than fighting label placement after the fact.
Left on its default, the centre sometimes displays a segment count or the largest value instead of the total you want. Open the centre text setting and point it at the sum explicitly, then re-check it after any edit to the underlying rows.
¿No estás seguro de que el Donut Chart sea la opción correcta? Descubre qué es, cuándo usarlo y cuándo no.
Two columns and one header row: category names in the first column, one raw number per category in the second. CSV and .xlsx both work, and a pasted range from any spreadsheet tool is fine too. Don't pre-calculate percentages; PlotSet does that from the raw values.
Gratis para empezar con más de 300 plantillas. No se necesita tarjeta de crédito.