
Cada gráfico empezó como una hoja de cálculo.
Mapas, bar chart races, treemaps, pictogramas y más. Abre uno y rehazlo con tus datos.
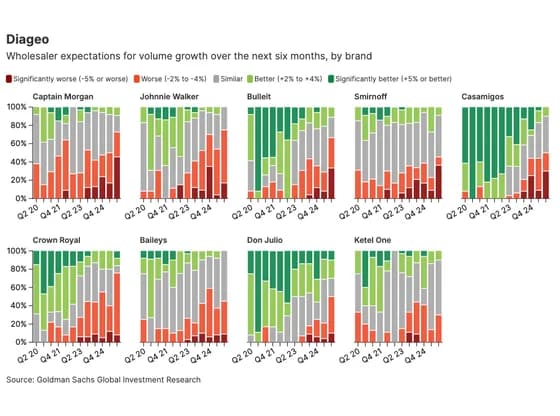 Line, bar and pie chartsDiageo
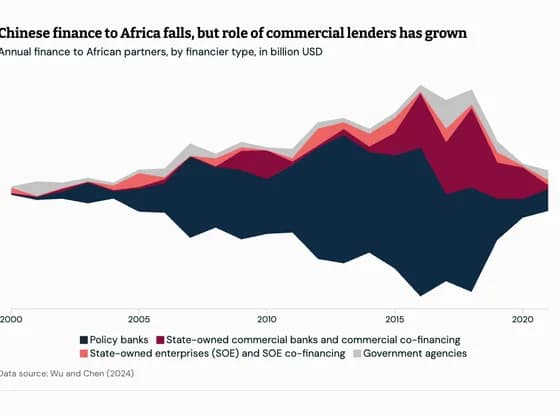 Line, bar and pie chartsChinese finance to Africa falls, but role of commercial lenders has grown
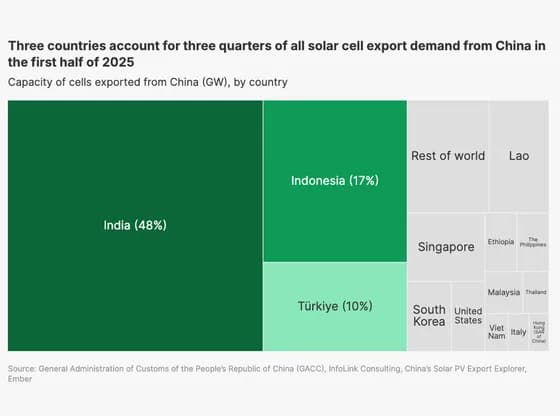 HierarchyThree countries account for three quarters of all solar cell export demand from China in the…
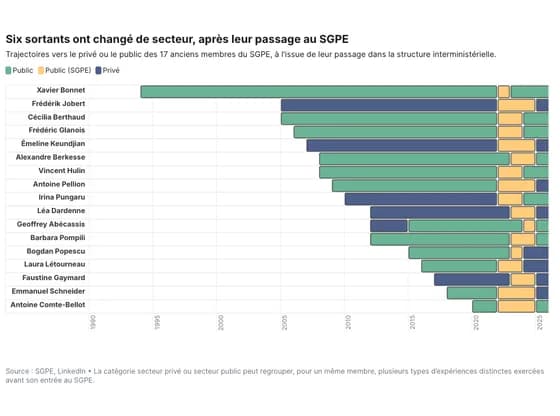 Gantt chartSix sortants ont changé de secteur, après leur passage au SGPE
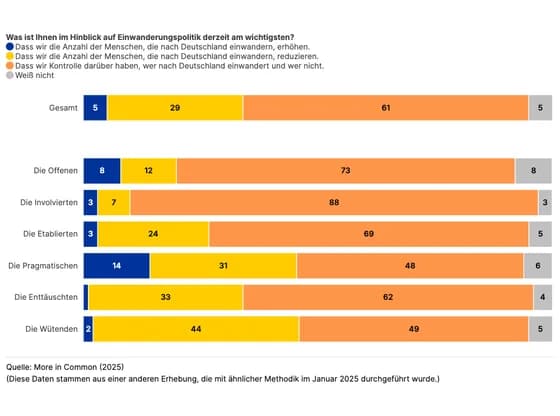 Line, bar and pie charts#348 E50- (ETM design) Kontrolle Erhöhen Reduzieren
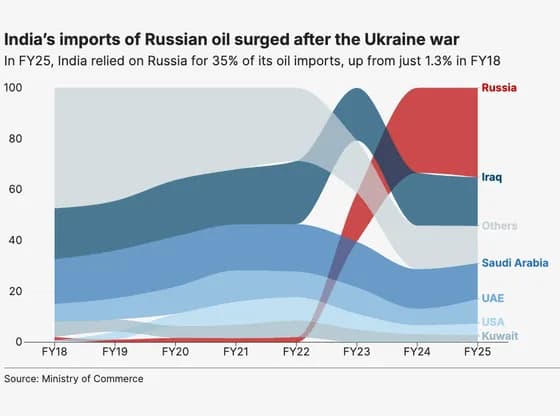 Line, bar and pie chartsIndia’s imports of Russian oil surged after the Ukraine war
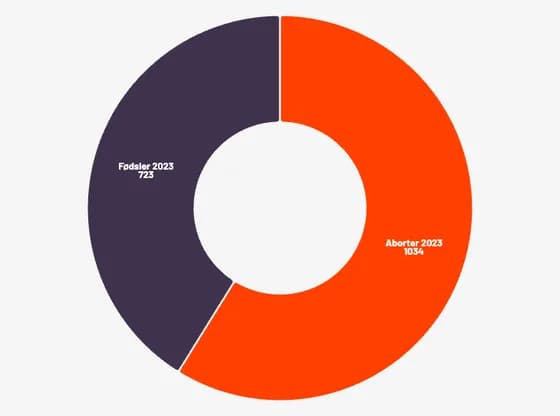 Line, bar and pie chartsI Grønland blev der i 2023 foretaget flere aborter end fødsler
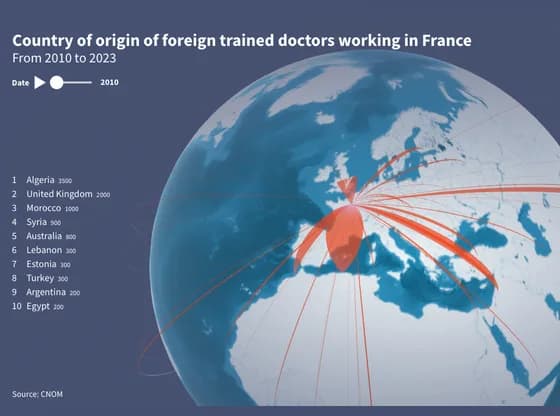 Connections and flow mapsCountry of origin of foreign trained doctors working in France
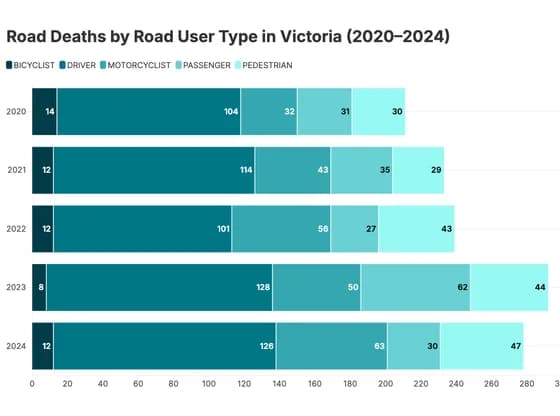 Line, bar and pie chartsRoad Deaths by Road User Type in Victoria (2020–2024)
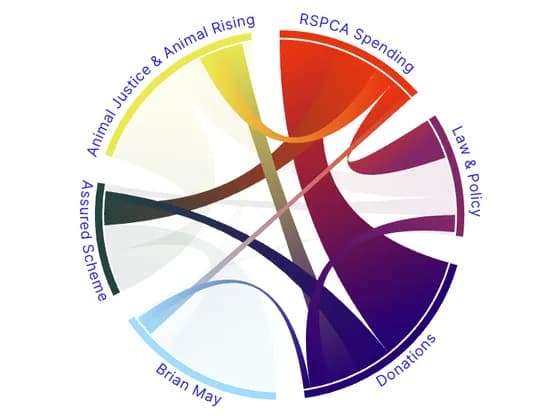 Network graphThe intersection (% overlap) between RSPCA Spending and Donating to the RSPCA September 2024
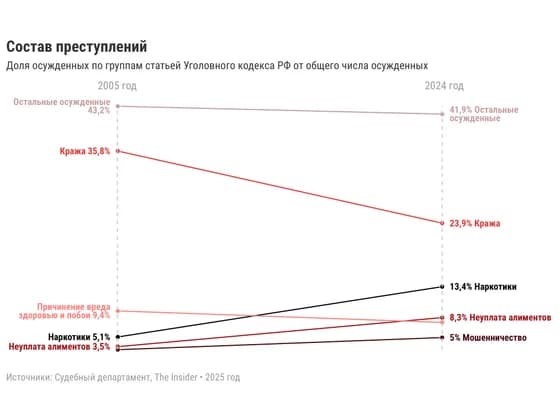 Slope chartСостав преступлений
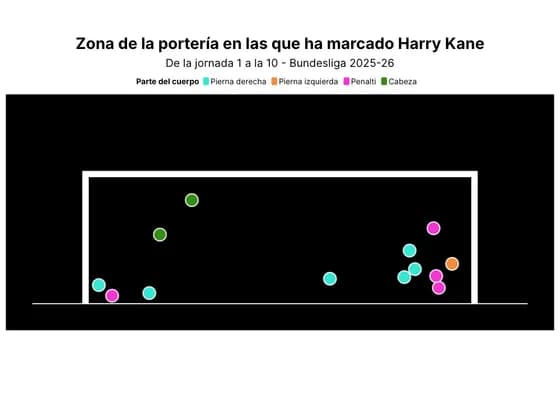 SportsZona de la portería en las que ha marcado Harry Kane
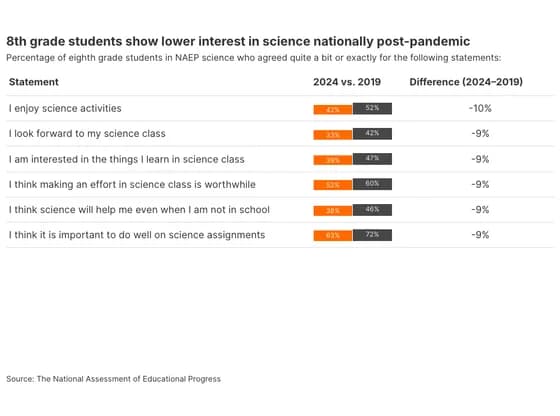 Table8th grade students show lower interest in science nationally post-pandemic
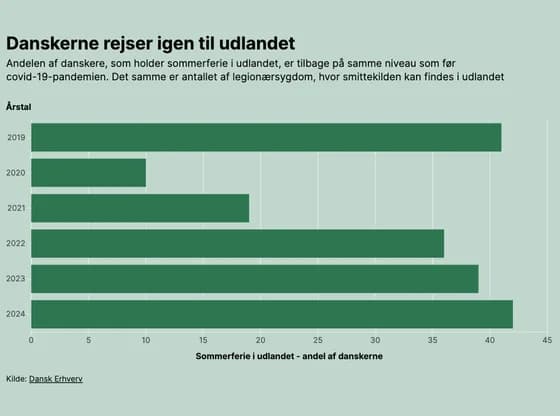 Line, bar and pie chartsDanskerne rejser igen til udlandet
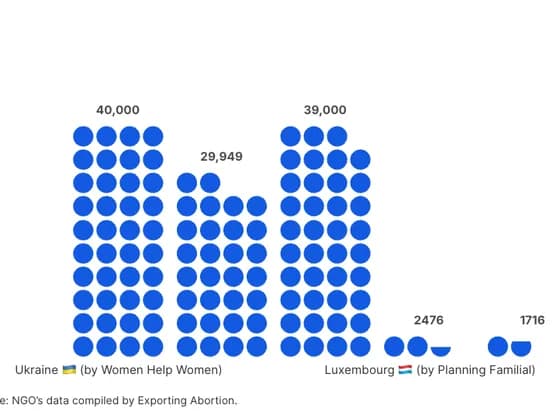 PictogramAbortion pill packages distributed by NGO's between 2019 and 2023
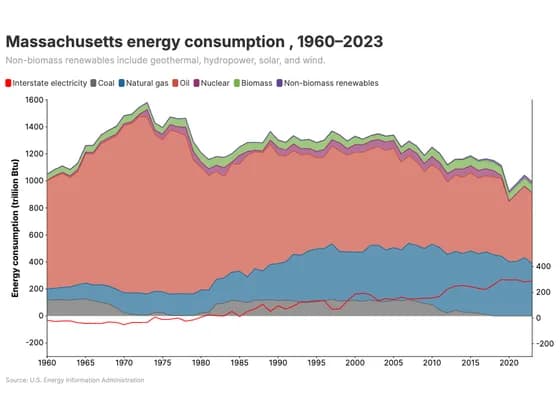 Line, bar and pie chartsMassachusetts energy consumption , 1960–2023
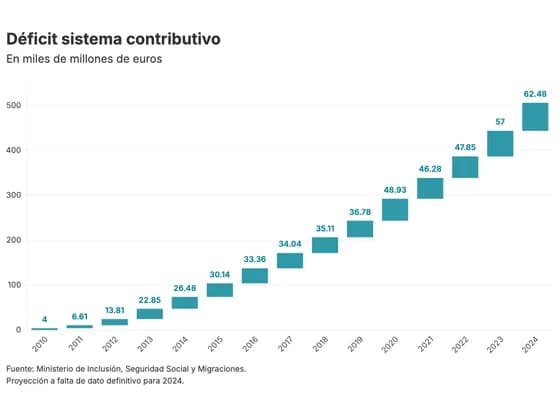 Line, bar and pie chartsDéficit sistema contributivo
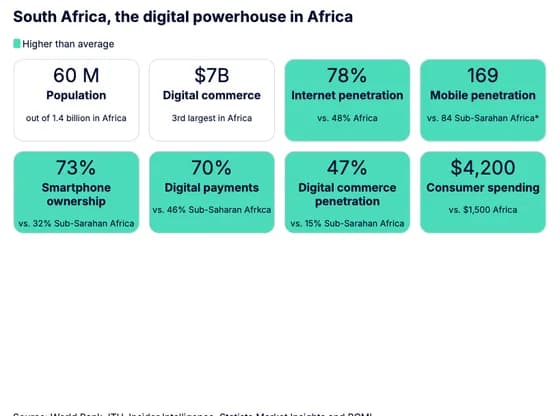 CardsSouth Africa, the digital powerhouse in Africa
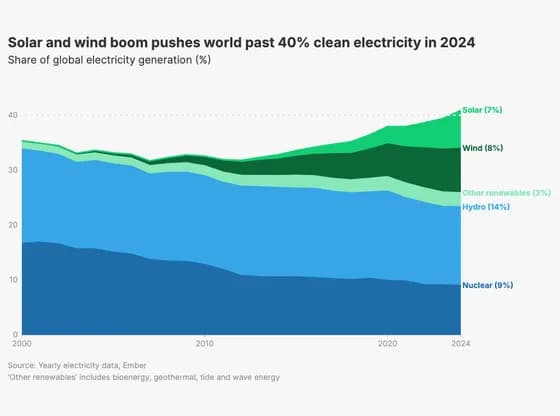 Line, bar and pie chartsSolar and wind boom pushes world past 40% clean electricity in 2024
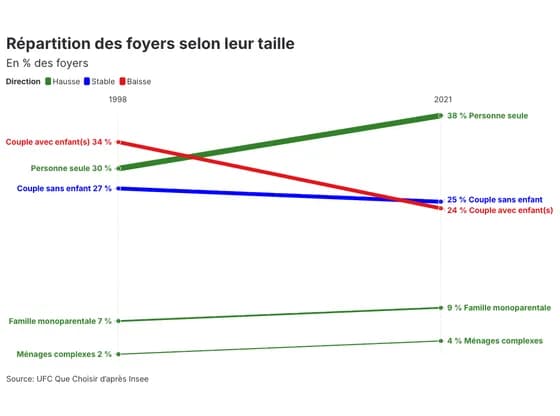 Slope chartRépartition des foyers selon leur taille