
Cada gráfico empezó como una hoja de cálculo.
Mapas, bar chart races, treemaps, pictogramas y más. Abre uno y rehazlo con tus datos.
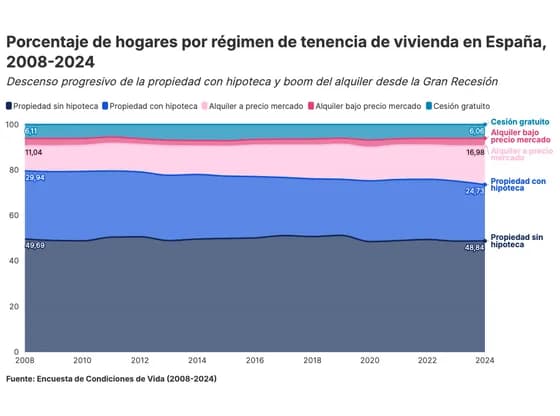 Line, bar and pie chartsPorcentaje de hogares por régimen de tenencia de vivienda en España, 2008-2024
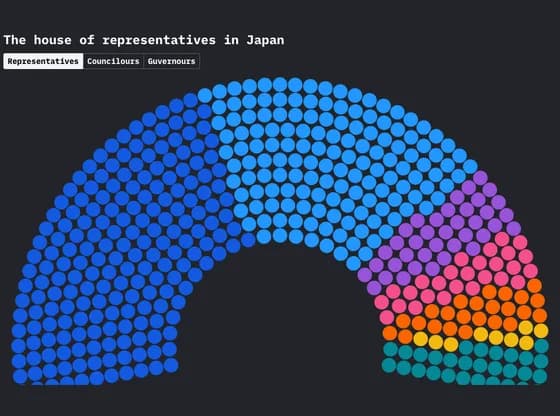 Elections and parliamentsThe house of representatives in Japan
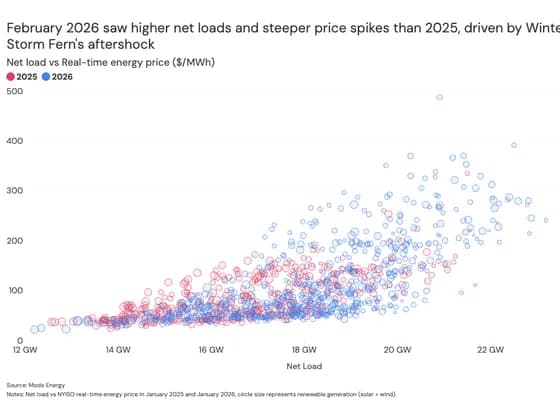 ScatterFebruary 2026 saw higher net loads and steeper price spikes than 2025, driven by Winter Storm…
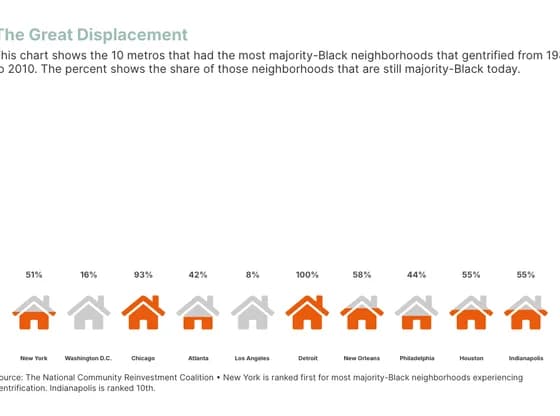 PictogramThe Great Displacement
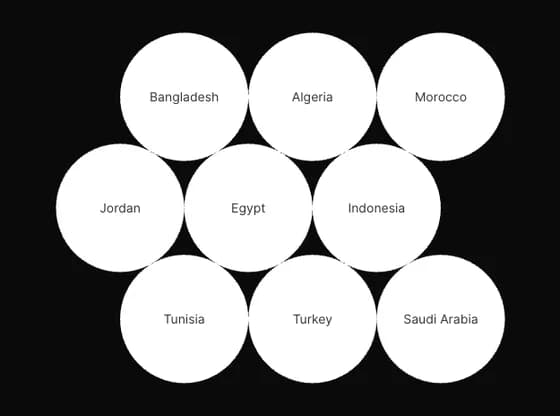 Interactive toolsThe wheat supply chain, from mills to bakeries
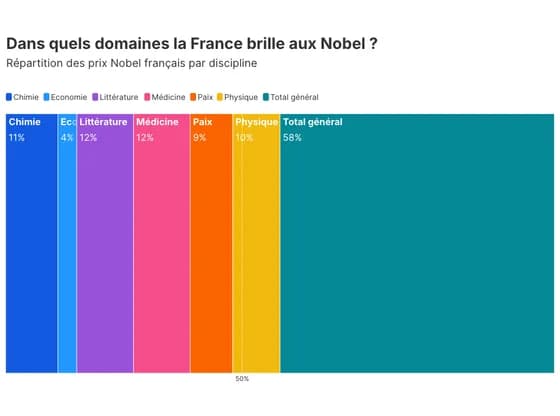 Elections and parliamentsDans quels domaines la France brille aux Nobel ?
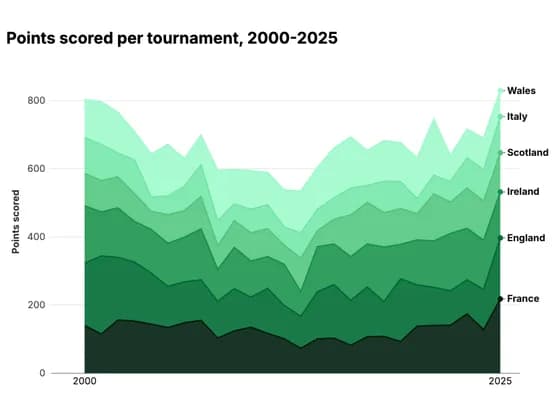 Line, bar and pie chartsPoints scored per tournament, 2000-2025
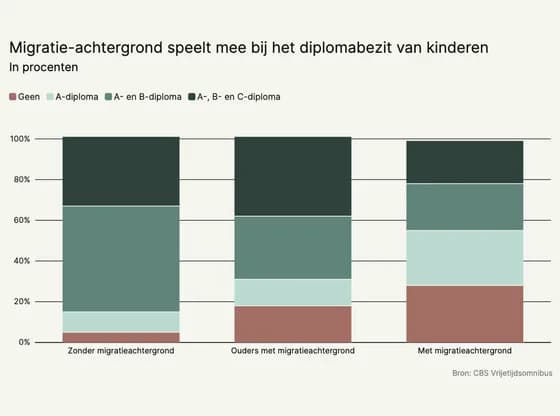 Line, bar and pie chartsMigratie-achtergrond speelt mee bij het diplomabezit van kinderen
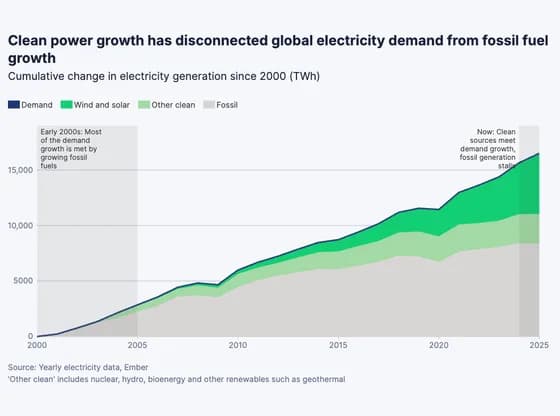 Line, bar and pie chartsClean power growth has disconnected global electricity demand from fossil fuel growth
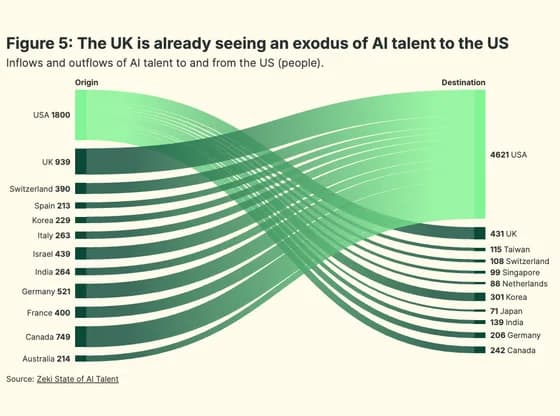 Sankey diagramFigure 5: The UK is already seeing an exodus of AI talent to the US
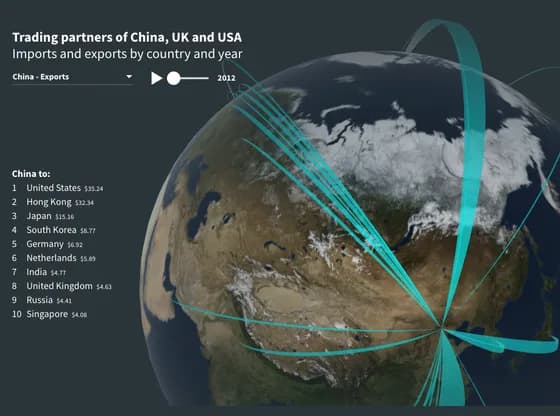 Connections and flow mapsTrading partners of China, UK and USA
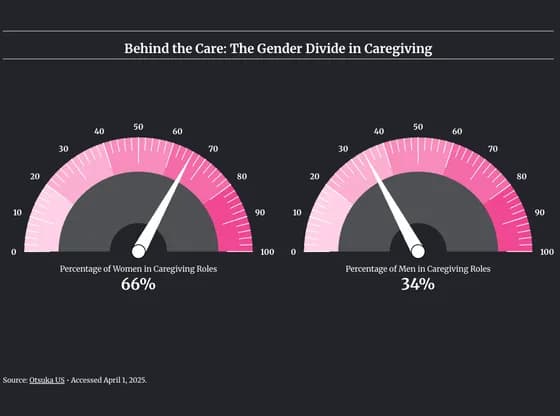 Counters and gaugesBehind the Care: The Gender Divide in Caregiving
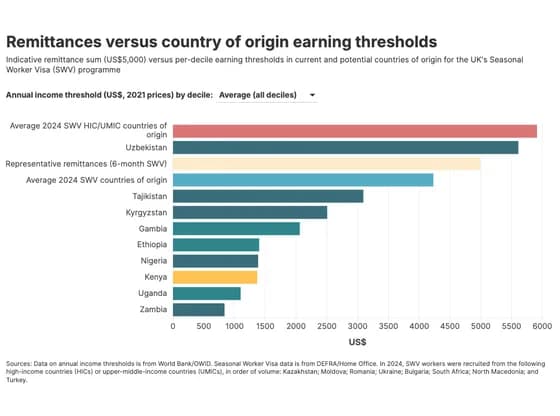 Line, bar and pie chartsRemittances versus country of origin earning thresholds
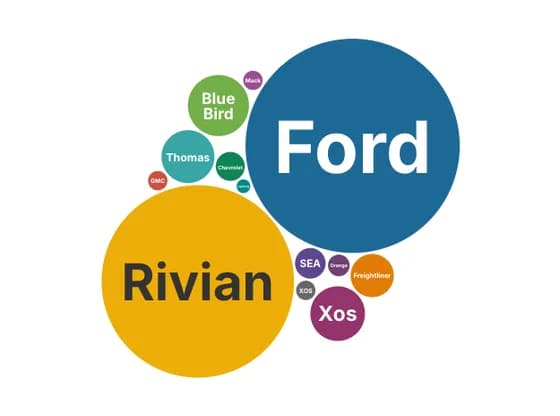 Distribution chartsRebates for truck electric vehicles by manufacturer, 2022–2025
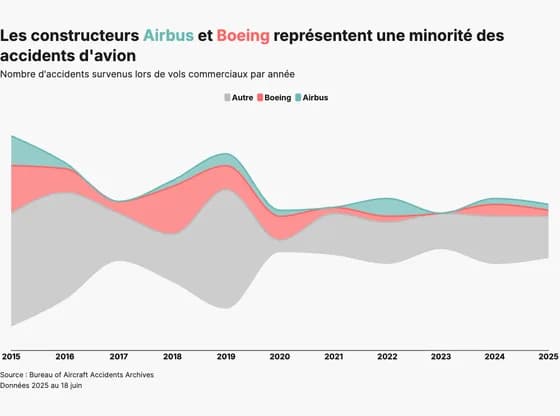 Line, bar and pie chartsLes constructeurs Airbus et Boeing représentent une minorité des accidents d'avion
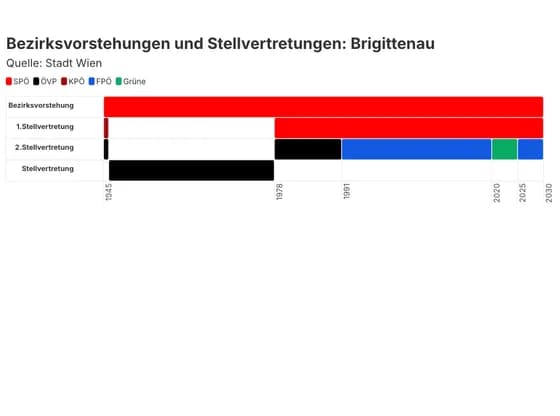 Gantt chartBezirksvorstehungen und Stellvertretungen: Brigittenau
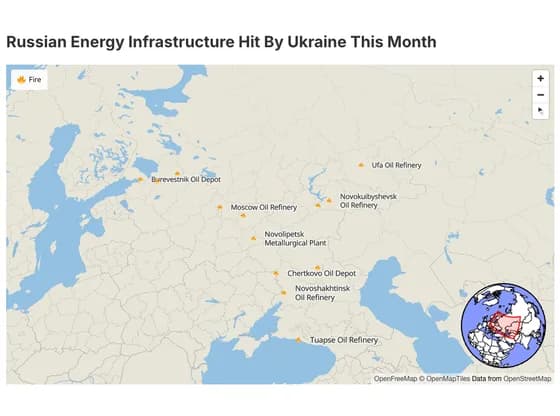 3D mapRussian Energy Infrastructure Hit By Ukraine This Month
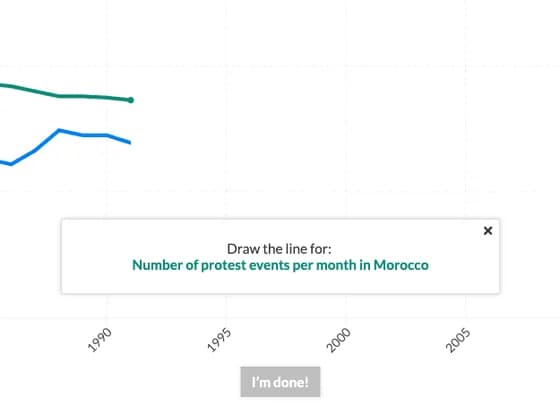 Interactive toolsDraw the line chart
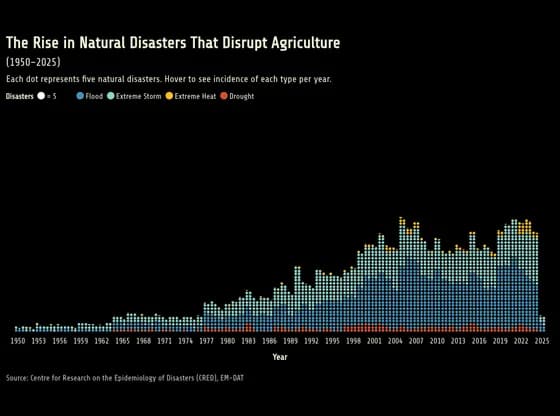 PictogramThe Rise in Natural Disasters That Disrupt Agriculture
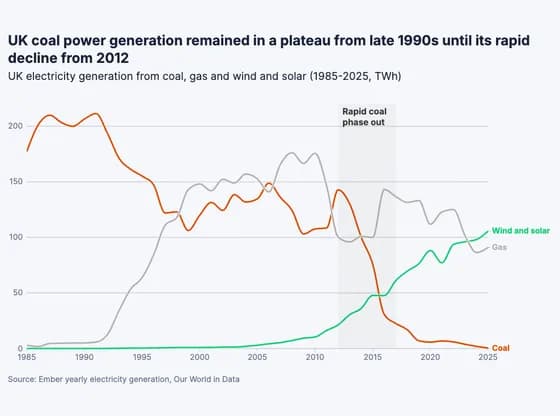 Line, bar and pie chartsUK coal power generation remained in a plateau from late 1990s until its rapid decline from 2012