
Cada gráfico empezó como una hoja de cálculo.
Mapas, bar chart races, treemaps, pictogramas y más. Abre uno y rehazlo con tus datos.
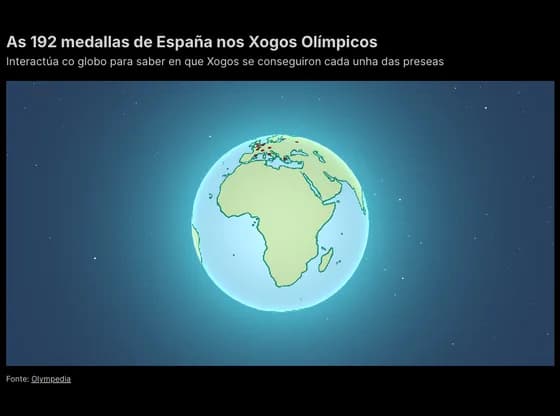 3D globeAs 192 medallas de España nos Xogos Olímpicos
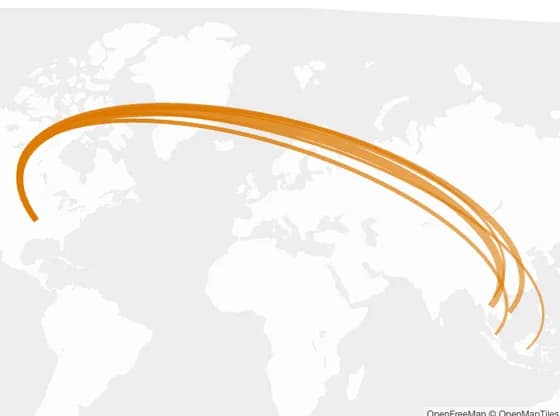 3D mapUS solar panel and solar cell imports during Q4 2024
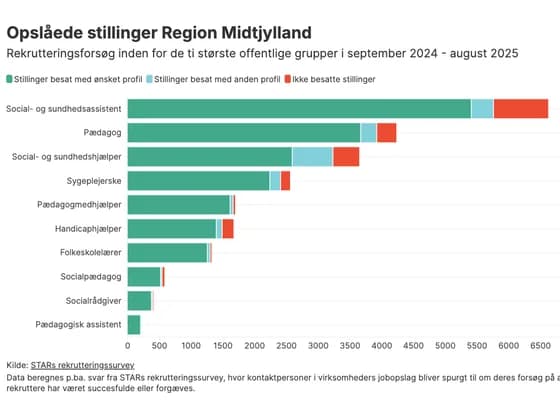 Line, bar and pie chartsOpslåede stillinger Region Midtjylland
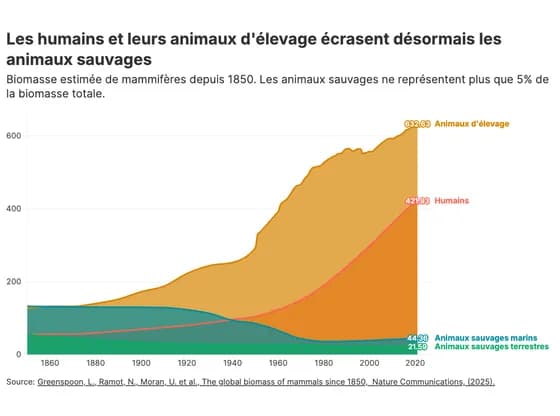 Line, bar and pie chartsLes humains et leurs animaux d'élevage écrasent désormais les animaux sauvages
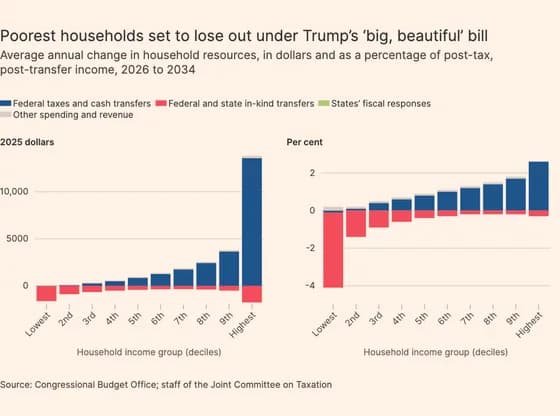 Line, bar and pie chartsPoorest households set to lose out under Trump’s ‘big, beautiful’ bill
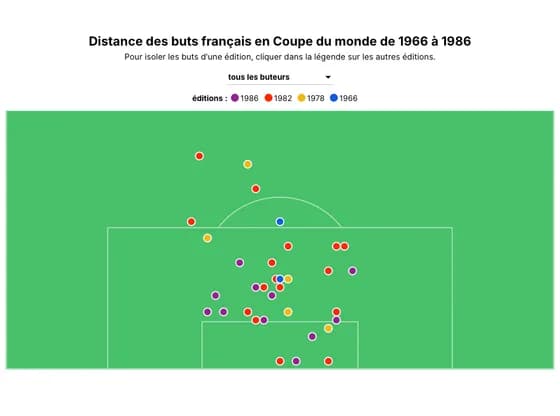 SportsDistance des buts français en Coupe du monde de 1966 à 1986
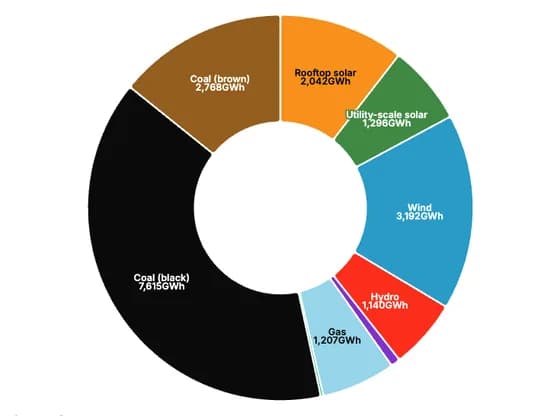 Line, bar and pie chartsContribution to the NEM's generation mix in August 2025
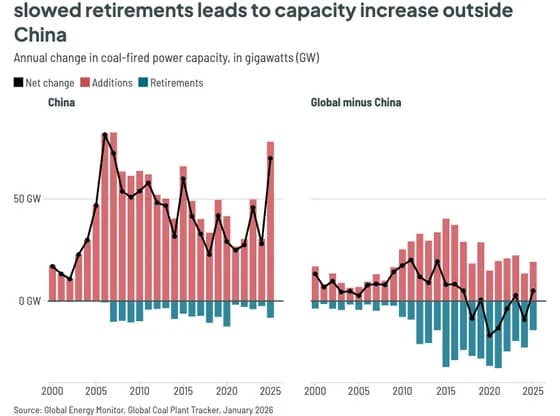 Line, bar and pie chartsChina drives second highest commissioning ever, while slowed retirements leads to capacity…
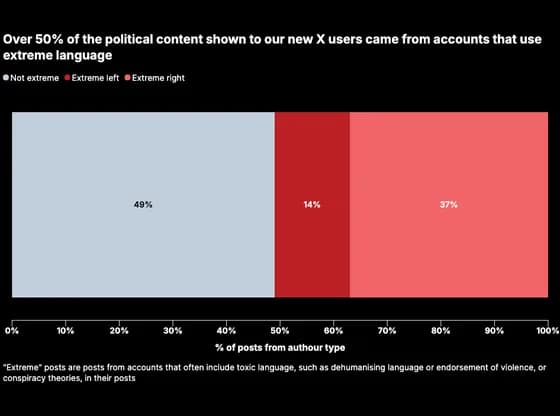 Line, bar and pie chartsOver 50% of the political content shown to our new X users came from accounts that use extreme…
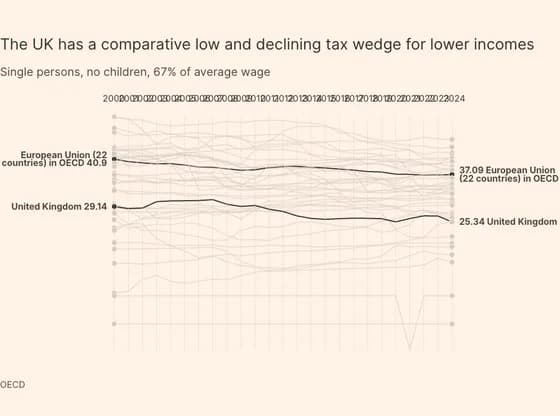 Slope chartThe UK has a comparative low and declining tax wedge for lower incomes
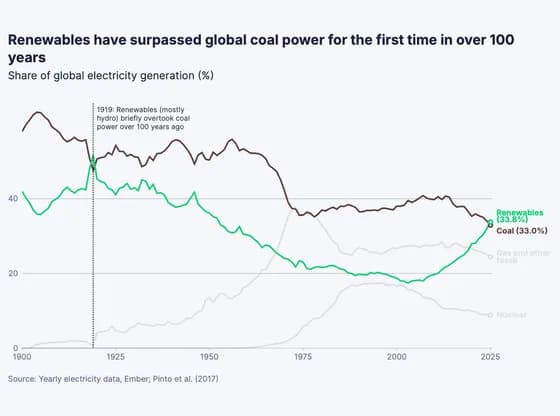 Line, bar and pie chartsRenewables have surpassed global coal power for the first time in over 100 years
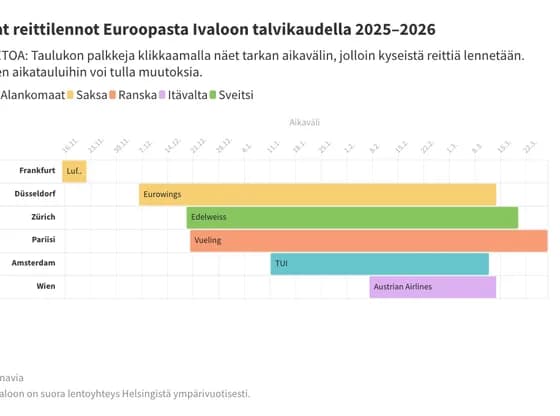 Gantt chartSuorat reittilennot Euroopasta Ivaloon talvikaudella 2025–2026
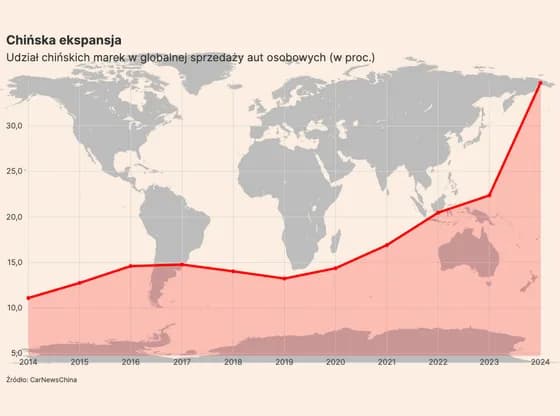 Line, bar and pie chartsChińska ekspansja
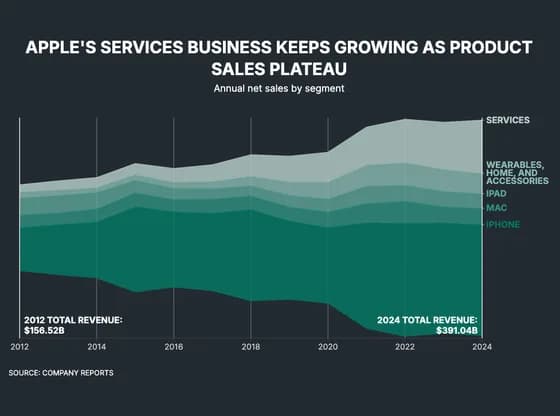 Line, bar and pie chartsAPPLE'S SERVICES BUSINESS KEEPS GROWING AS PRODUCT SALES PLATEAU
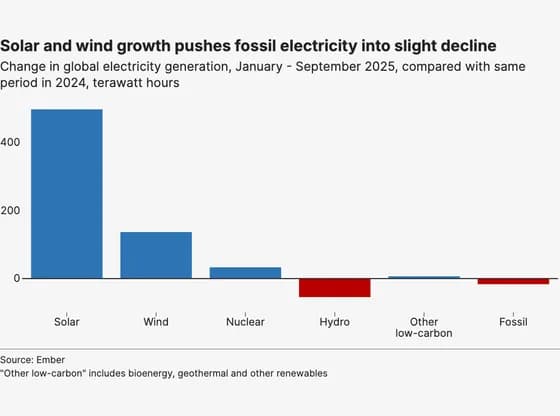 Line, bar and pie chartsSolar and wind growth pushes fossil electricity into slight decline
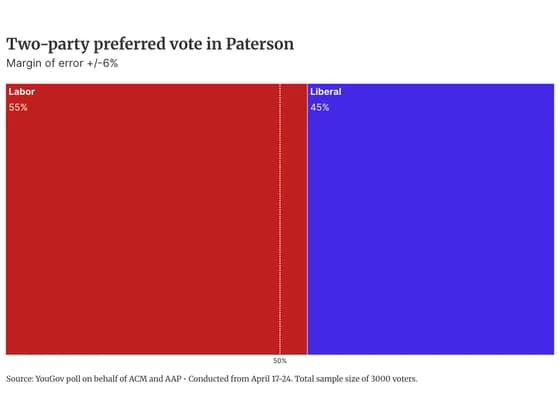 Elections and parliamentsTwo-party preferred vote in Paterson
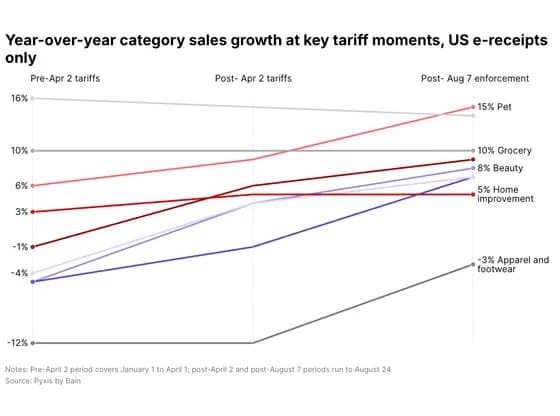 Slope chartYear-over-year category sales growth at key tariff moments, US e-receipts only
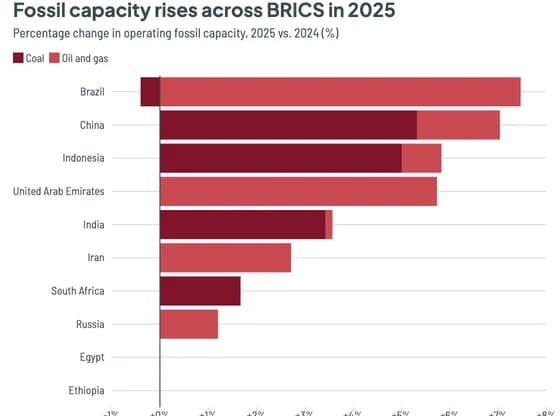 Line, bar and pie chartsFossil capacity rises across BRICS in 2025
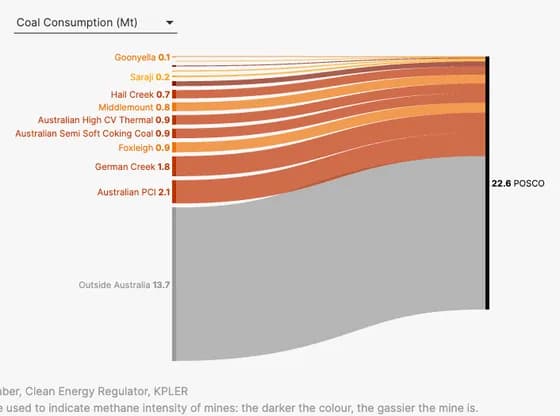 Sankey diagramIn 2024, almost one fourth of coal mine methane emissions in POSCO's supply chain was from Australia
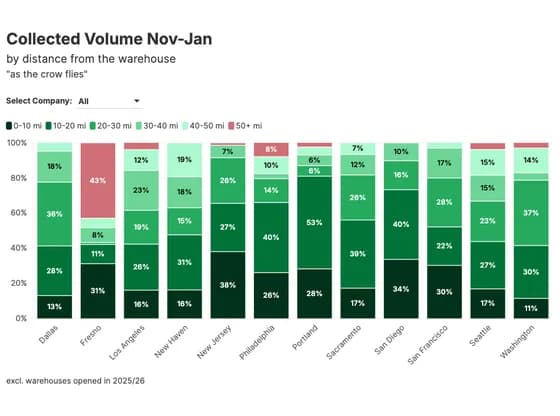 Line, bar and pie chartsCollected Volume Nov-Jan