
Cada gráfico empezó como una hoja de cálculo.
Mapas, bar chart races, treemaps, pictogramas y más. Abre uno y rehazlo con tus datos.
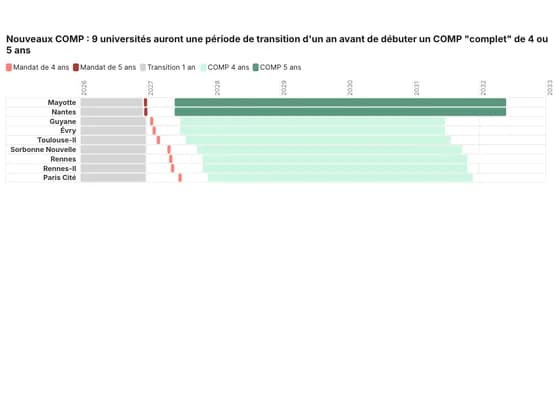 Gantt chartNouveaux COMP : 9 universités auront une période de transition d'un an avant de débuter un COMP…
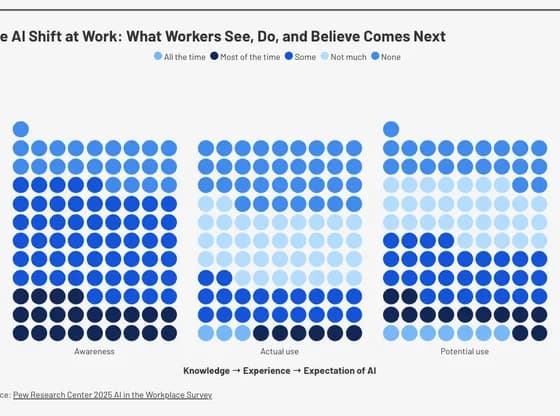 PictogramThe AI Shift at Work: What Workers See, Do, and Believe Comes Next
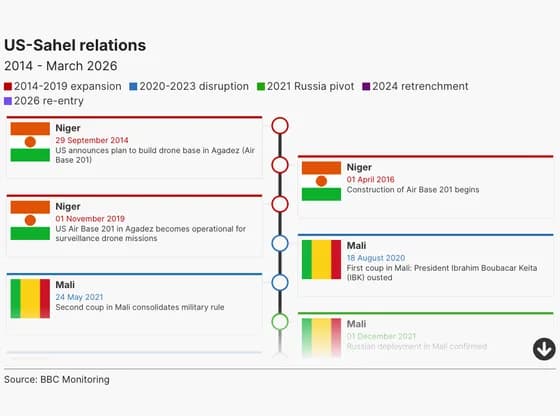 TimelineUS-Sahel relations
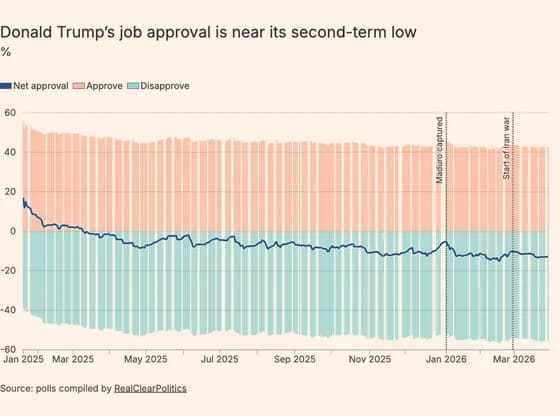 Line, bar and pie chartsDonald Trump’s job approval is near its second-term low
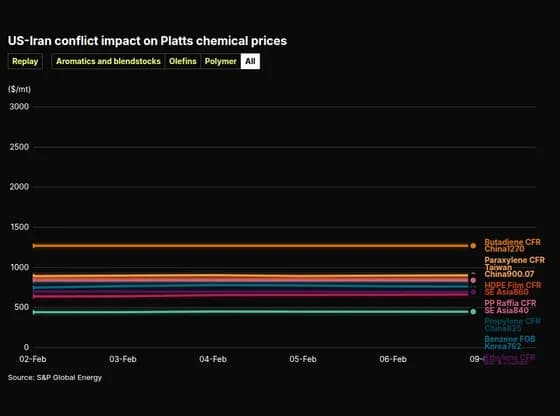 Animated chartsUS-Iran conflict impact on Platts chemical prices
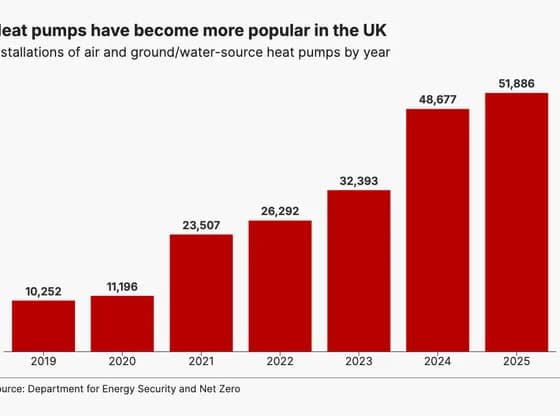 Line, bar and pie chartsHeat pumps have become more popular in the UK
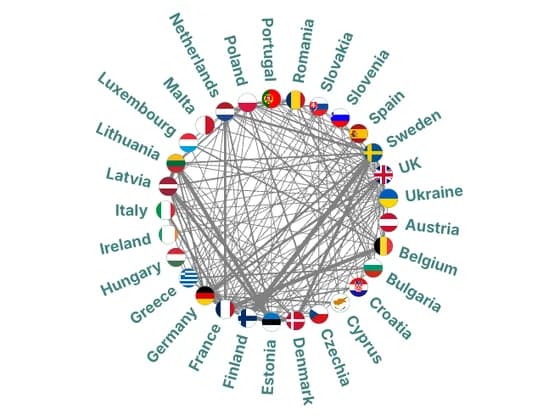 Network graphGRAPH 4: Constellation of bilateral defence partnerships (EU27, UK and Ukraine, 2014 - September…
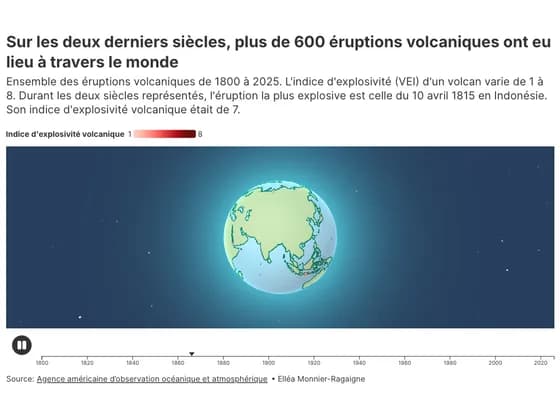 3D globeSur les deux derniers siècles, plus de 600 éruptions volcaniques ont eu lieu à travers le monde
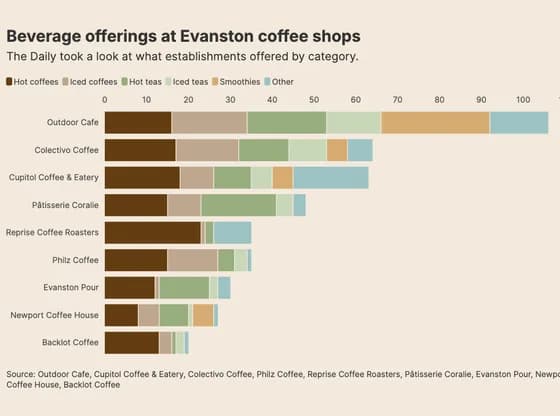 Line, bar and pie chartsBeverage offerings at Evanston coffee shops
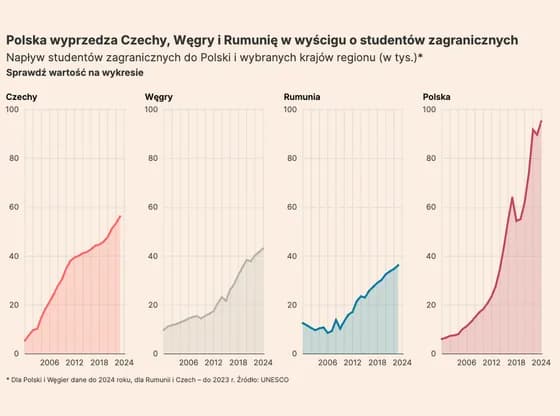 Line, bar and pie chartsPolska wyprzedza Czechy, Węgry i Rumunię w wyścigu o studentów zagranicznych
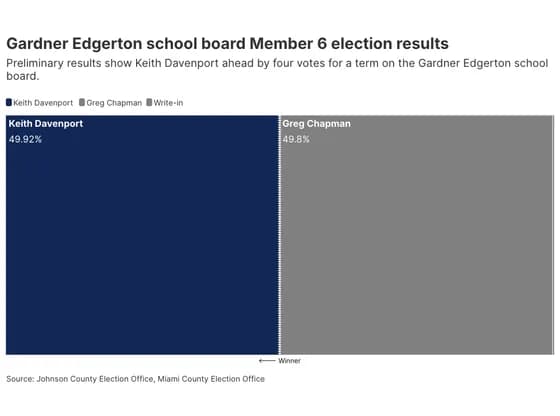 Elections and parliamentsGardner Edgerton school board Member 6 election results
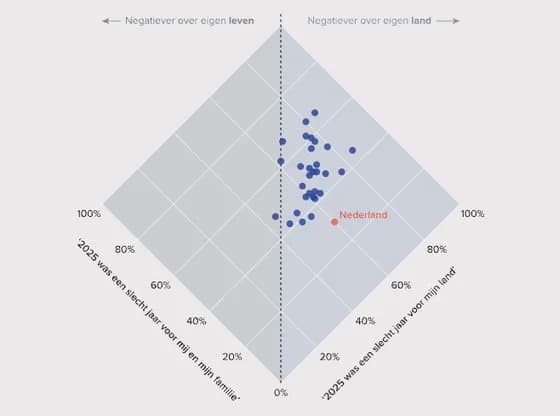 Interactive SVG20260407 - SvT - Het gaat slecht 01 SVG
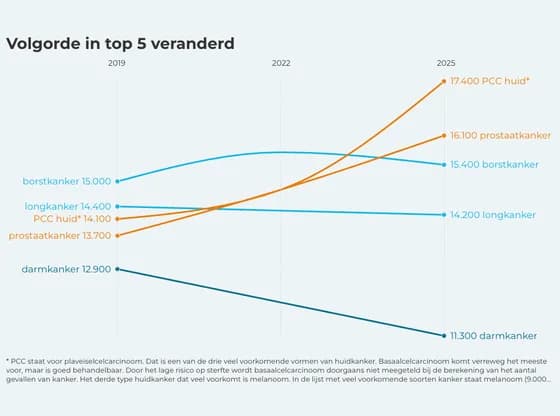 Slope chartVolgorde in top 5 veranderd
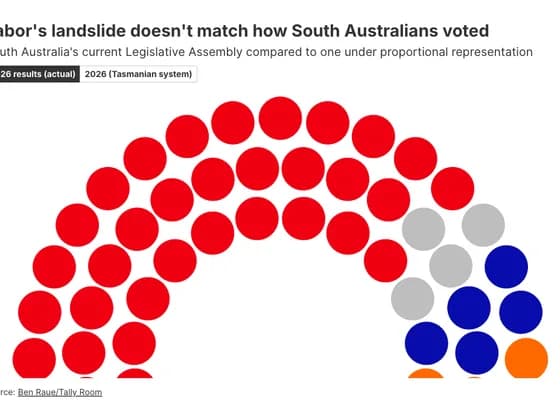 Elections and parliamentsLabor's landslide doesn't match how South Australians voted
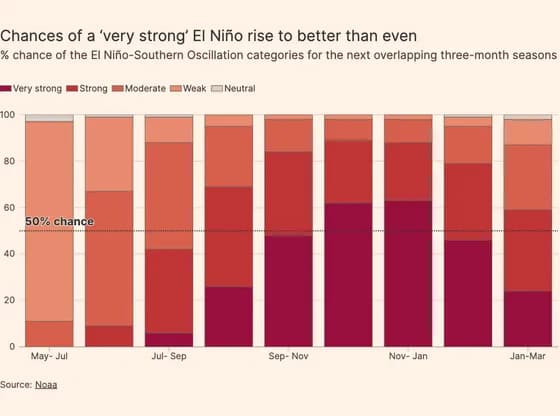 Line, bar and pie chartsChances of a ‘very strong’ El Niño rise to better than even
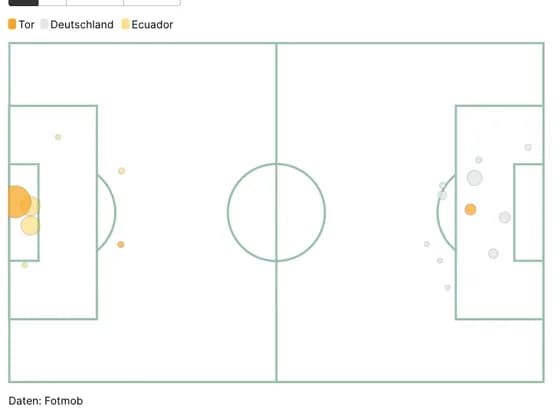 SportsDFB-Teamr Chancen vs Ecuado
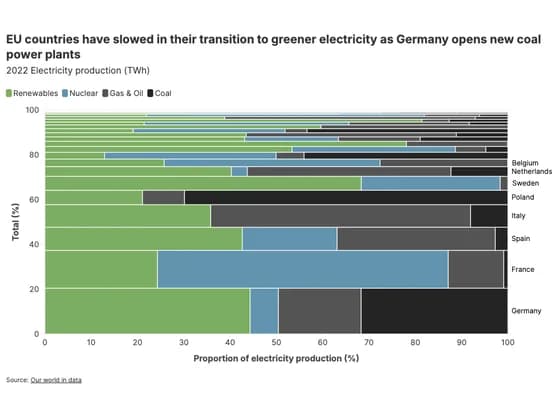 MarimekkoEU countries have slowed in their transition to greener electricity as Germany opens new coal…
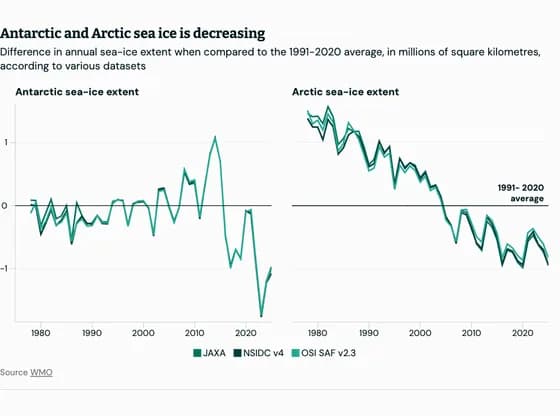 Line, bar and pie chartsAntarctic and Arctic sea ice is decreasing
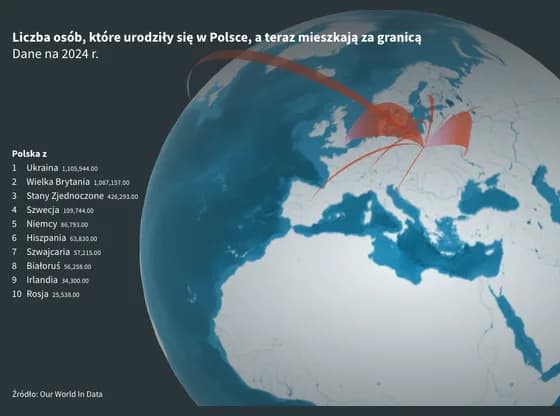 Connections and flow mapsLiczba osób, które urodziły się w Polsce, a teraz mieszkają za granicą
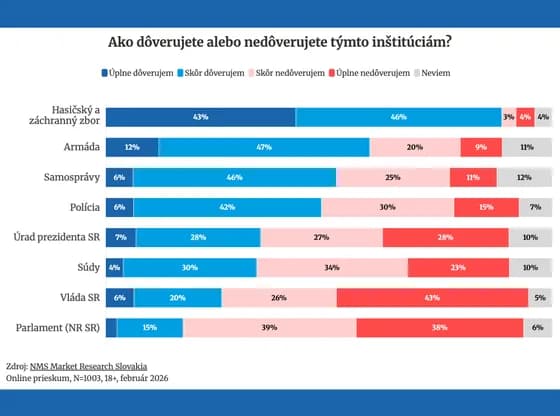 Line, bar and pie chartsAko dôverujete alebo nedôverujete týmto inštitúciám?