
Cada gráfico empezó como una hoja de cálculo.
Mapas, bar chart races, treemaps, pictogramas y más. Abre uno y rehazlo con tus datos.
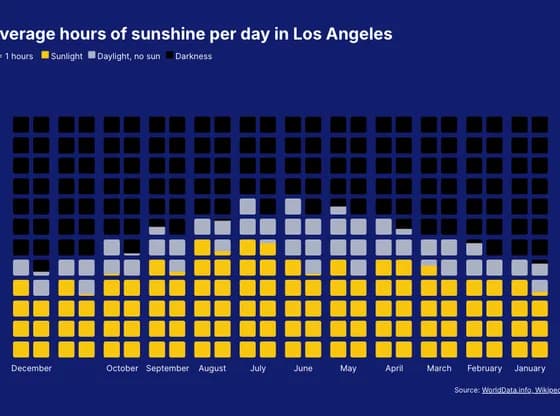 PictogramAverage hours of sunshine per day in Los Angeles
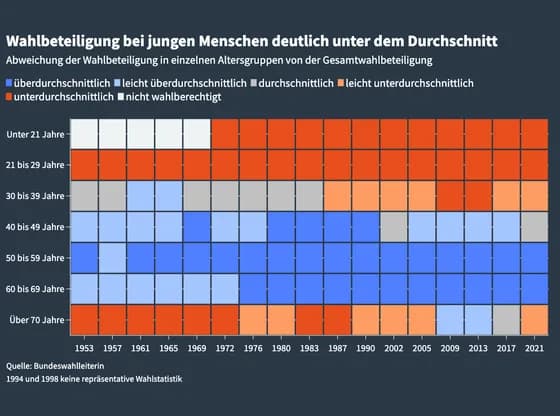 HeatmapWahlbeteiligung bei jungen Menschen deutlich unter dem Durchschnitt
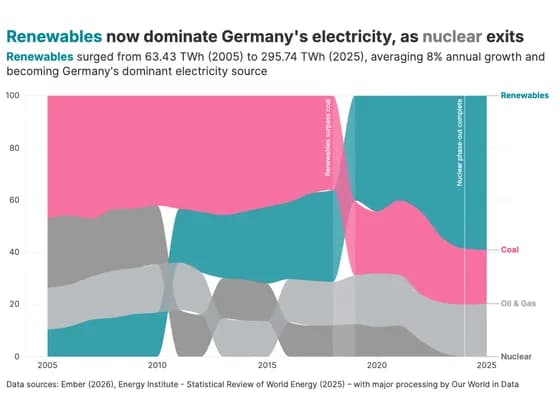 Line, bar and pie chartsRenewables now dominate Germany's electricity, as nuclear exits
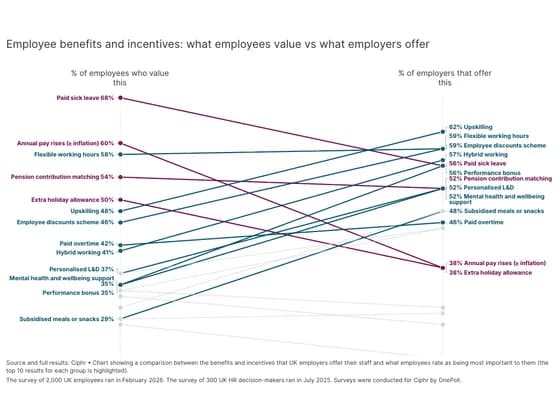 Slope chartEmployee benefits and incentives: what employees value vs what employers offer
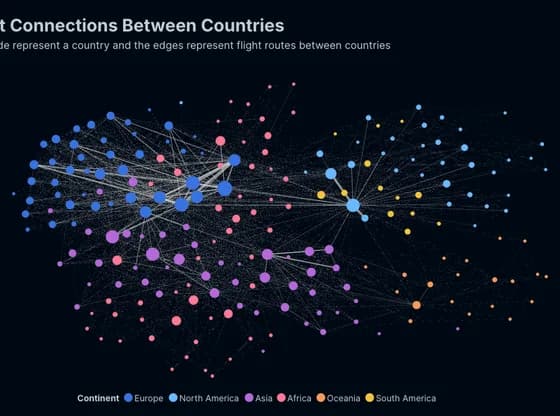 Network graphFlight Connections Between Countries
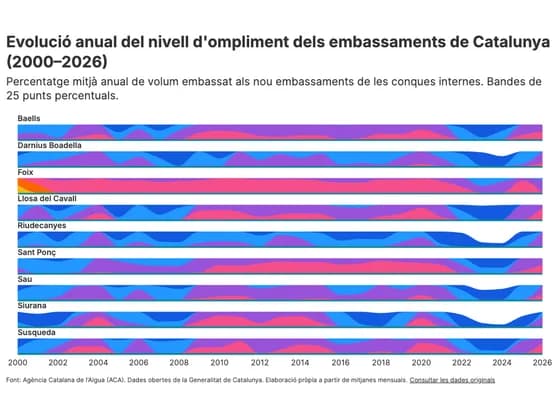 Line, bar and pie chartsEvolució anual del nivell d'ompliment dels embassaments de Catalunya (2000–2026)
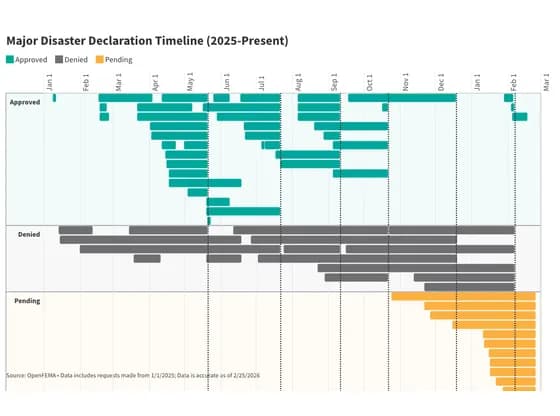 Gantt chartMajor Disaster Declaration Timeline (2025-Present)
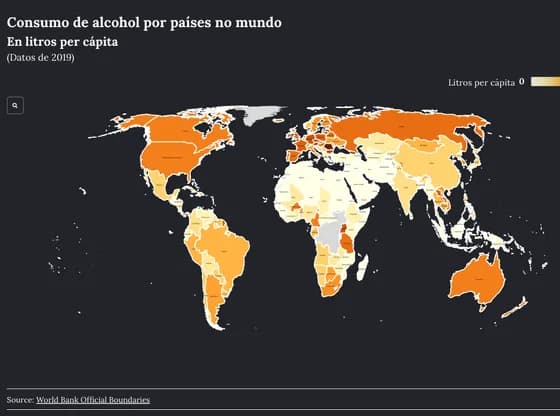 MapsConsumo de alcohol por países no mundo
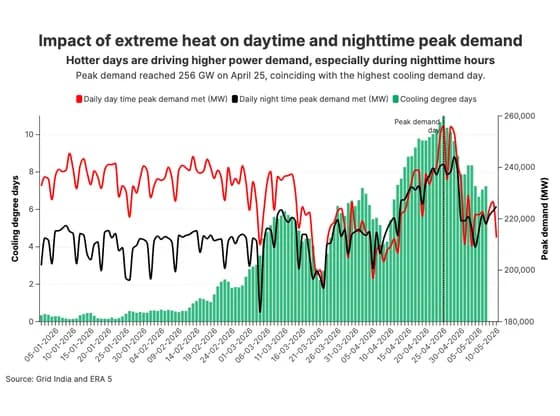 Line, bar and pie chartsImpact of extreme heat on daytime and nighttime peak demand
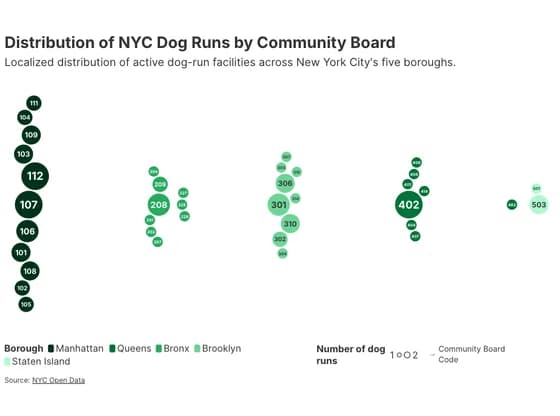 Distribution chartsDistribution of NYC Dog Runs by Community Board
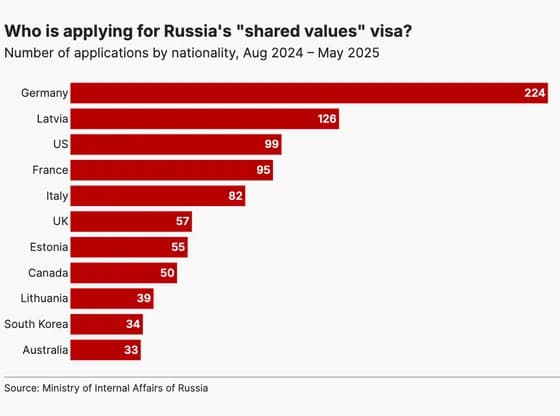 Line, bar and pie chartsWho is applying for Russia's "shared values" visa?
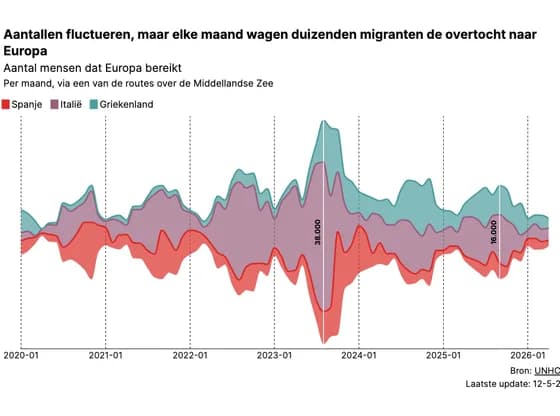 Line, bar and pie chartsAantallen fluctueren, maar elke maand wagen duizenden migranten de overtocht naar Europa
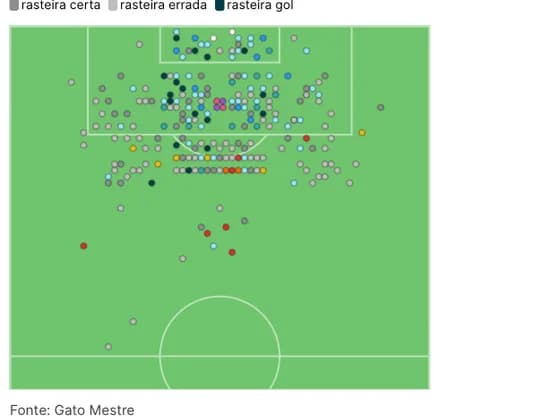 SportsDe onde finalizaram Argentina e Espanha na Copa
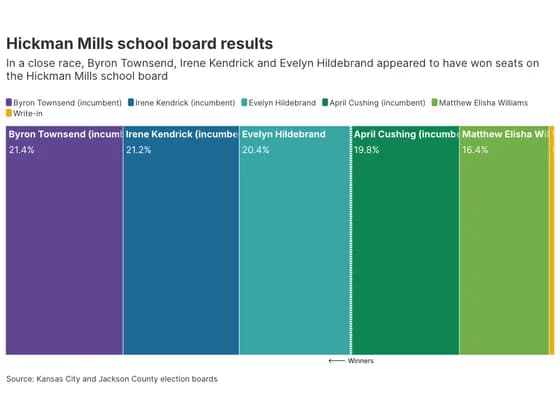 Elections and parliamentsHickman Mills school board results
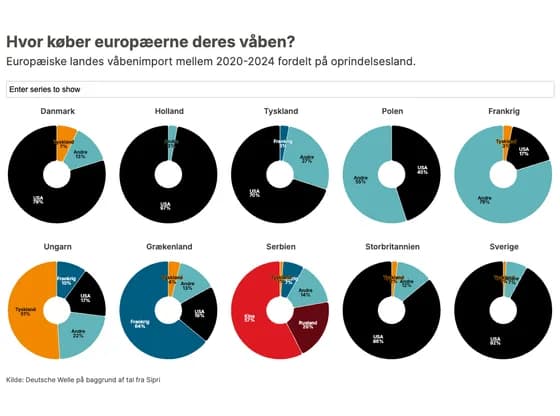 Line, bar and pie chartsHvor køber europæerne deres våben?
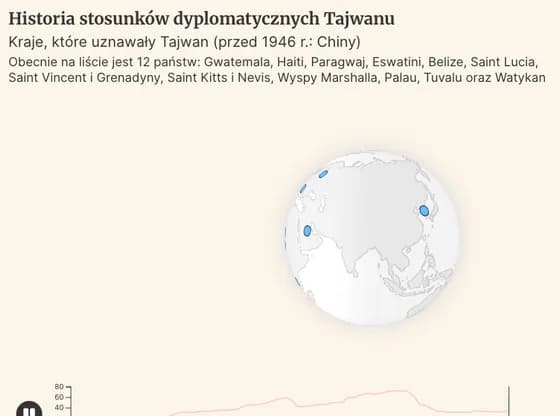 3D globeHistoria stosunków dyplomatycznych Tajwanu
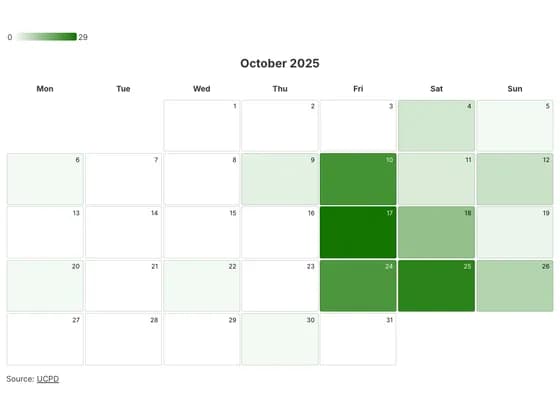 3D plotsOct Alc Chart
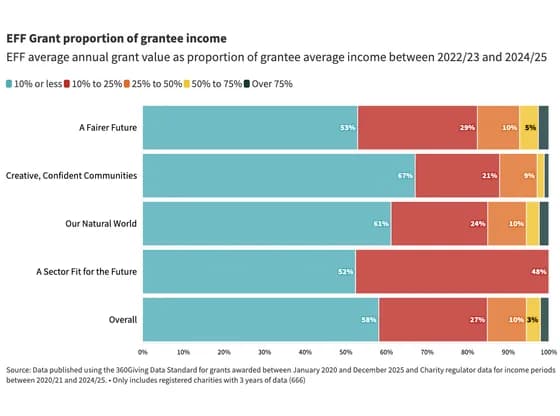 Line, bar and pie chartsEFF Grant proportion of grantee income
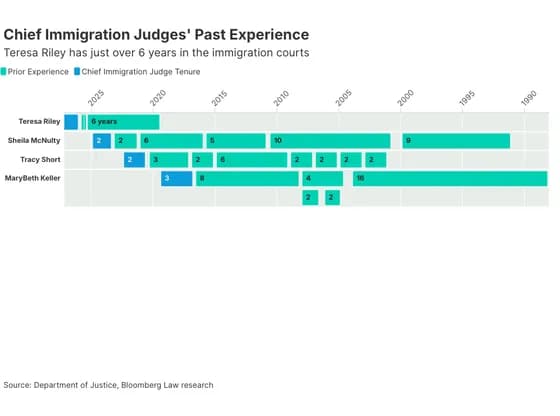 Gantt chartChief Immigration Judges' Past Experience
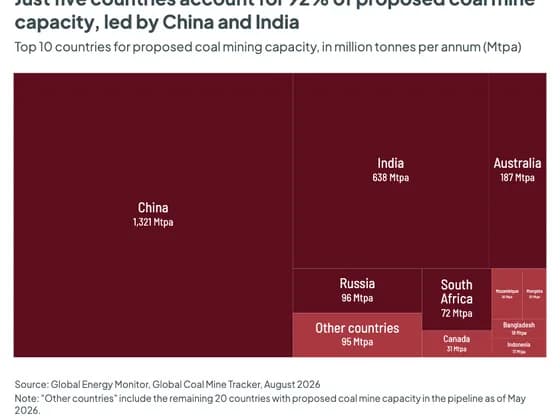 HierarchyJust five countries account for 92% of proposed coal mine capacity, led by China and India