
Cada gráfico empezó como una hoja de cálculo.
Mapas, bar chart races, treemaps, pictogramas y más. Abre uno y rehazlo con tus datos.
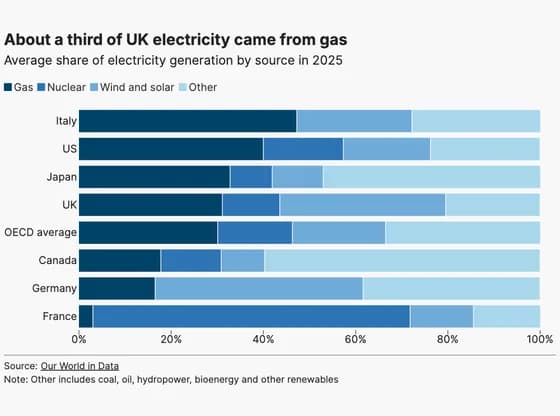 Line, bar and pie chartsAbout a third of UK electricity came from gas
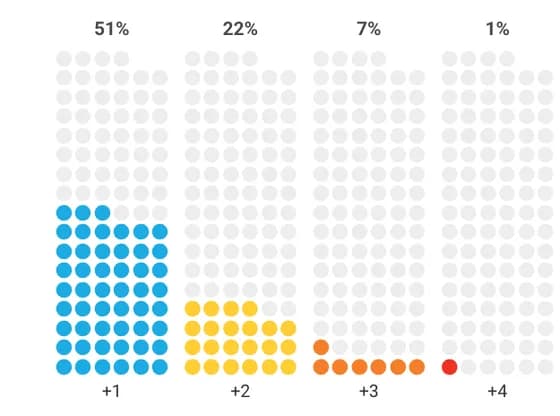 PictogramIf the world wants faster progress, it must focus on the children facing intersecting disadvantages
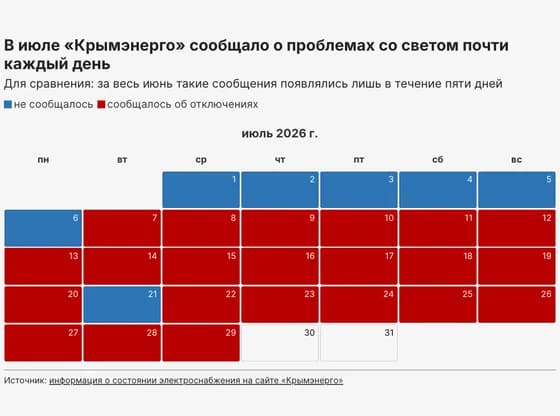 3D plotsВ июле «Крымэнерго» сообщало о проблемах со светом почти каждый день
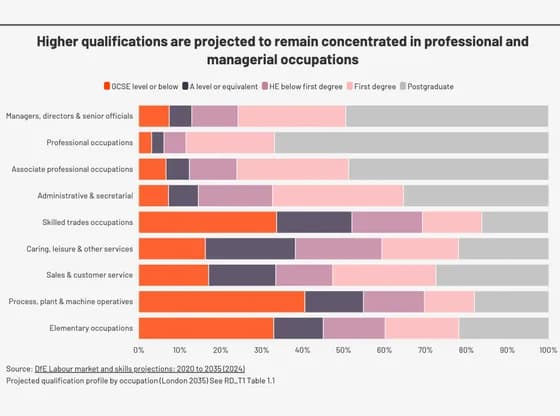 Line, bar and pie chartsHigher qualifications are projected to remain concentrated in professional and managerial…
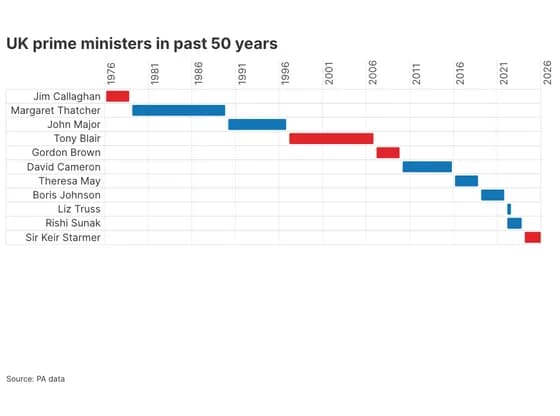 Gantt chartUK prime ministers in past 50 years
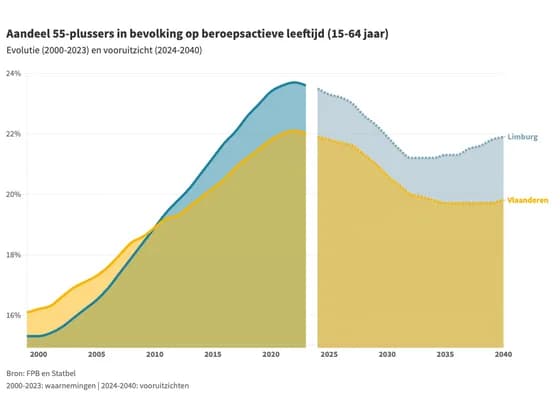 Line, bar and pie chartsAandeel 55-plussers in bevolking op beroepsactieve leeftijd (15-64 jaar)
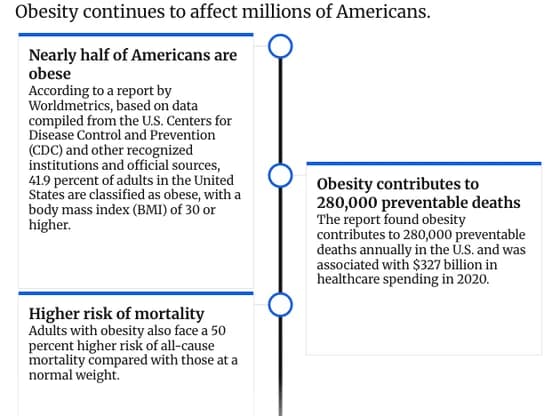 TimelineObesity Remains a Major Health Challenge in the U.S.
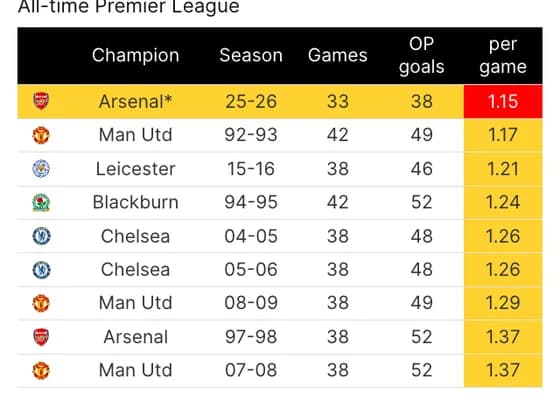 TableArsenal are on course to be the lowest-scoring champions from open play ever
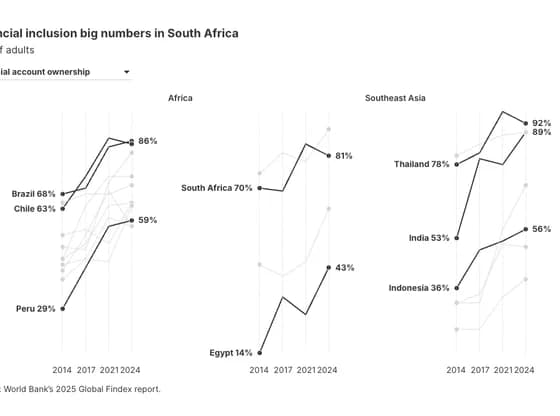 Slope chartFinancial inclusion big numbers in South Africa
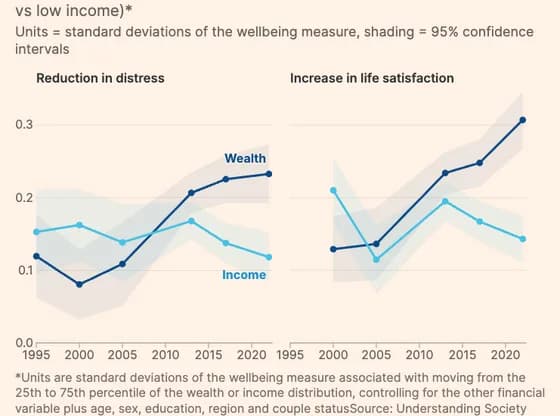 Line, bar and pie chartsIncome used to matter more for wellbeing; now wealth dominates
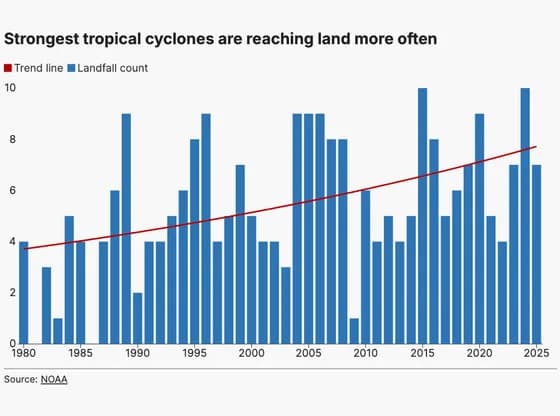 Line, bar and pie chartsStrongest tropical cyclones are reaching land more often
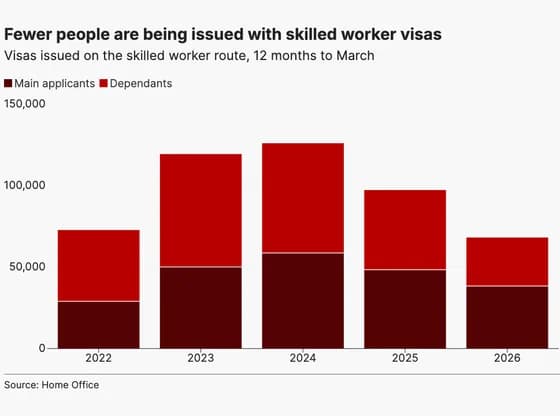 Line, bar and pie chartsFewer people are being issued with skilled worker visas
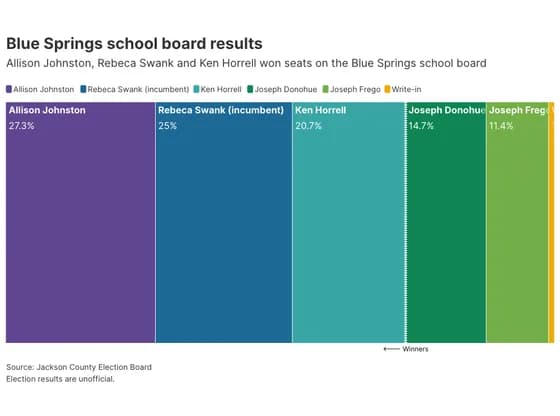 Elections and parliamentsBlue Springs school board results
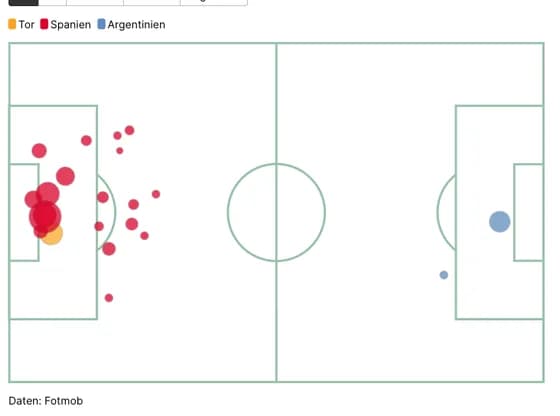 SportsSpanien Chancen vs Argentinien
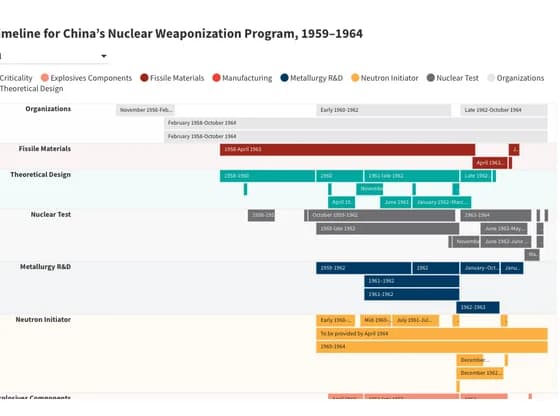 Gantt chartTimeline for China’s Nuclear Weaponization Program, 1959–1964
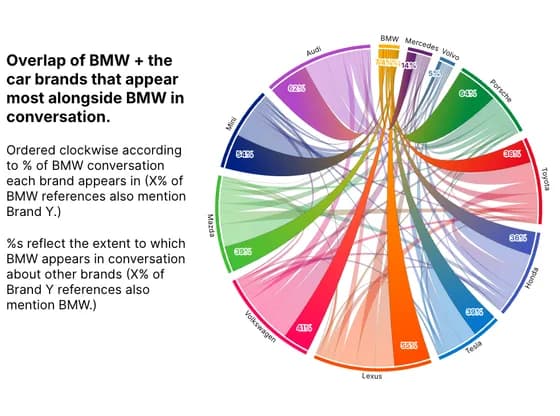 Network graphOverlap of BMW + the car brands that appear most alongside BMW in conversation.
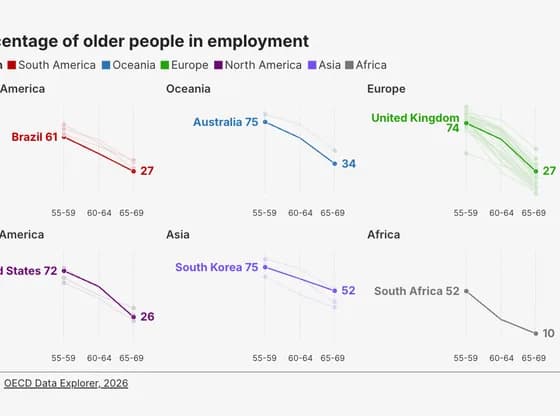 Slope chartPercentage of older people in employment
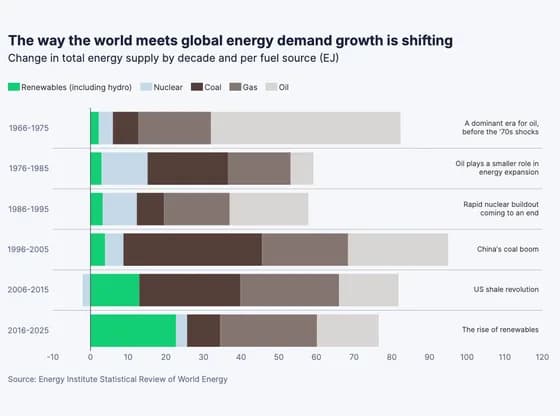 Line, bar and pie chartsThe way the world meets global energy demand growth is shifting
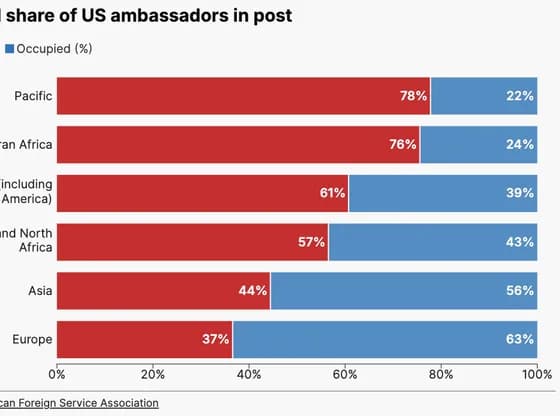 Line, bar and pie chartsRegional share of US ambassadors in post
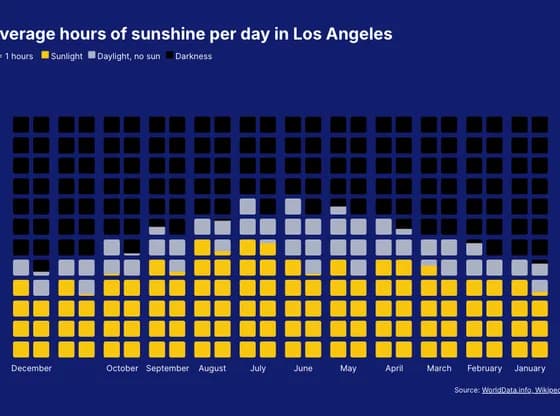 PictogramAverage hours of sunshine per day in Los Angeles