
Cada gráfico empezó como una hoja de cálculo.
Mapas, bar chart races, treemaps, pictogramas y más. Abre uno y rehazlo con tus datos.
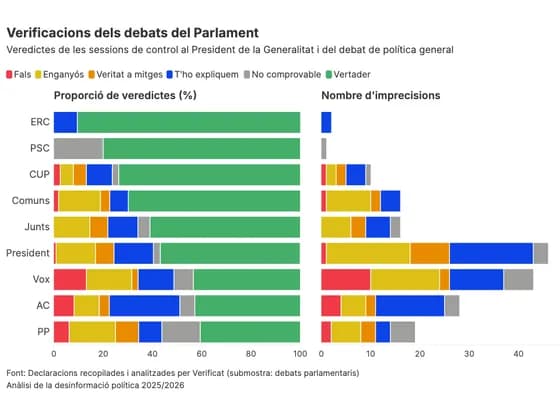 Line, bar and pie chartsVerificacions dels debats del Parlament
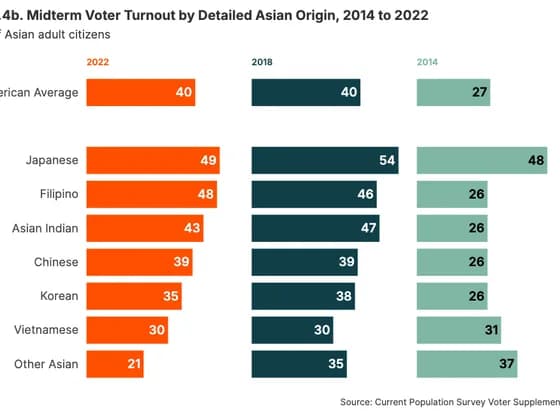 Line, bar and pie chartsFigure 9.4b. Midterm Voter Turnout by Detailed Asian Origin, 2014 to 2022
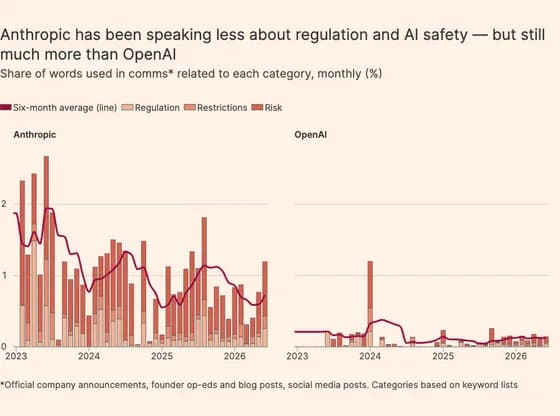 Line, bar and pie chartsAnthropic has been speaking less about regulation and AI safety — but still much more than OpenAI
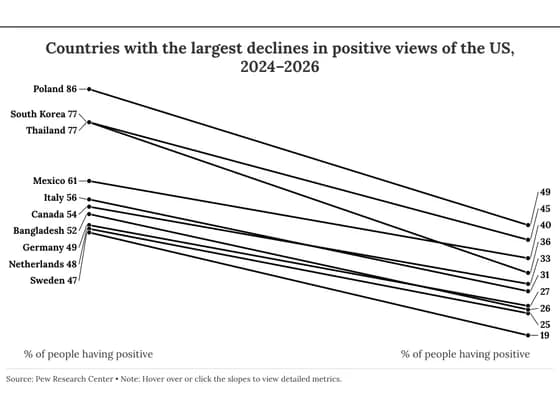 Slope chartCountries with the largest declines in positive views of the US, 2024–2026
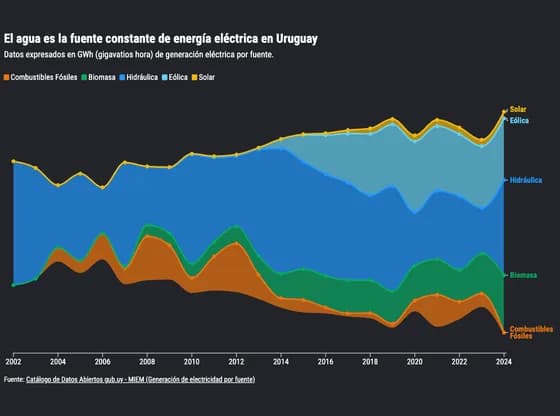 Line, bar and pie chartsEl agua es la fuente constante de energía eléctrica en Uruguay
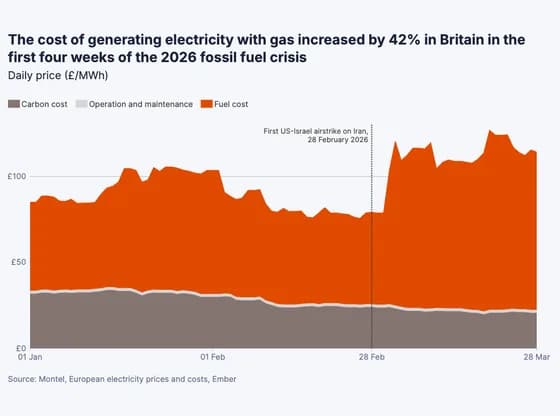 Line, bar and pie chartsThe cost of generating electricity with gas increased by 42% in Britain in the first four weeks…
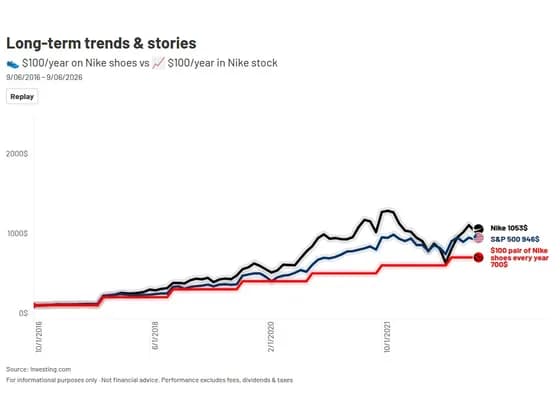 Animated chartsLong-term trends & stories
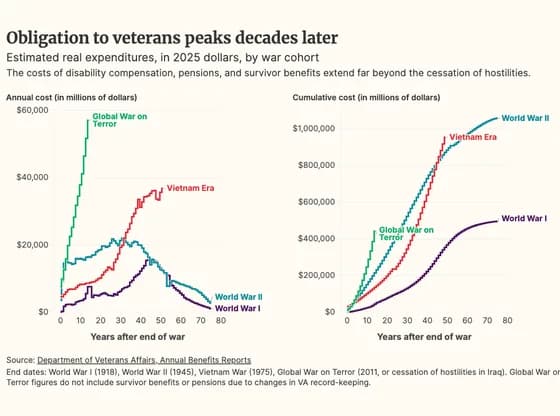 Line, bar and pie chartsObligation to veterans peaks decades later
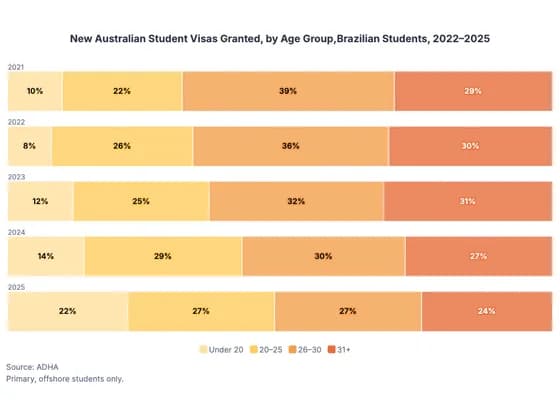 Line, bar and pie chartsNew Australian Student Visas Granted, by Age Group,Brazilian Students, 2022–2025
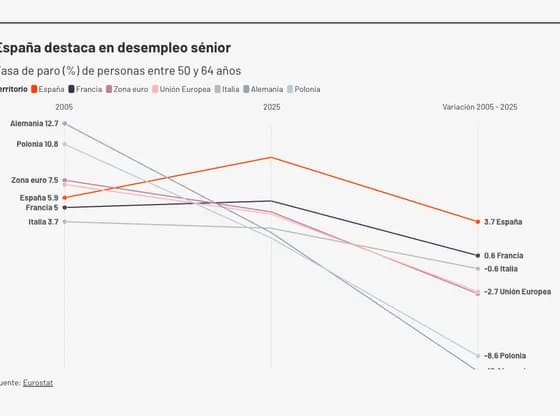 Slope chartEspaña destaca en desempleo sénior
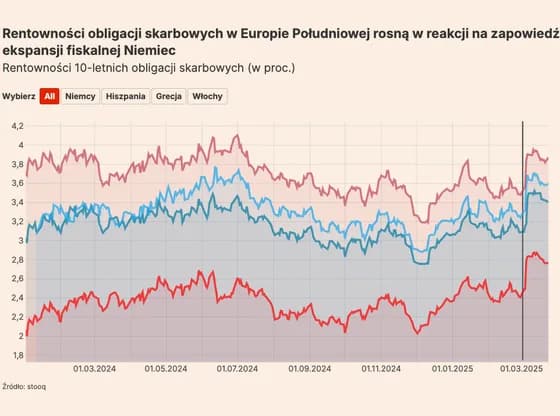 Line, bar and pie chartsRentowności obligacji skarbowych w Europie Południowej rosną w reakcji na zapowiedź ekspansji…
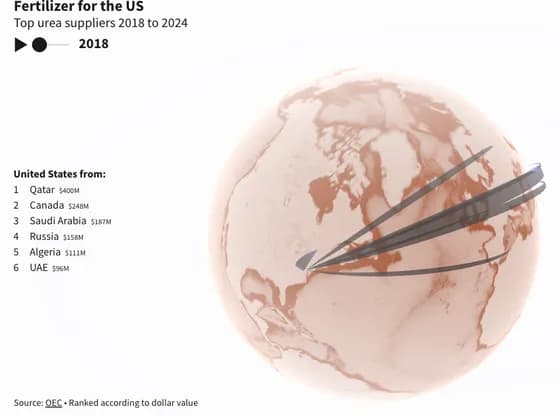 Connections and flow mapsFertilizer for the US
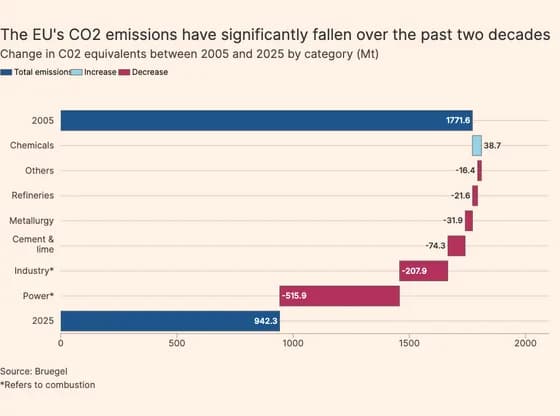 Line, bar and pie chartsThe EU's CO2 emissions have significantly fallen over the past two decades
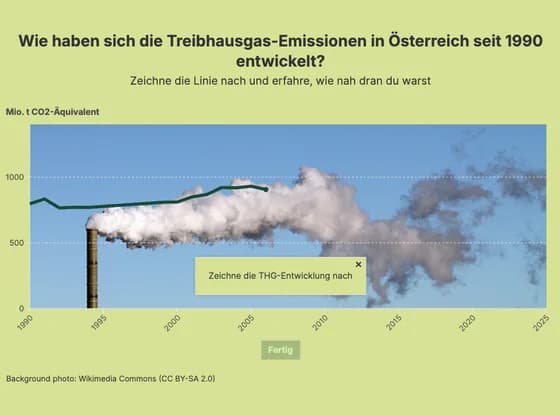 Interactive toolsWie haben sich die Treibhausgas-Emissionen in Österreich seit 1990 entwickelt?
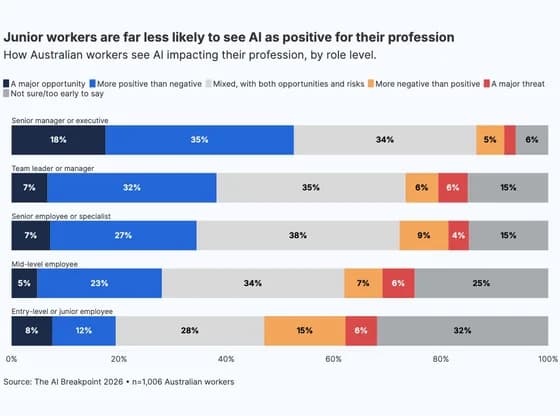 Line, bar and pie chartsJunior workers are far less likely to see AI as positive for their profession
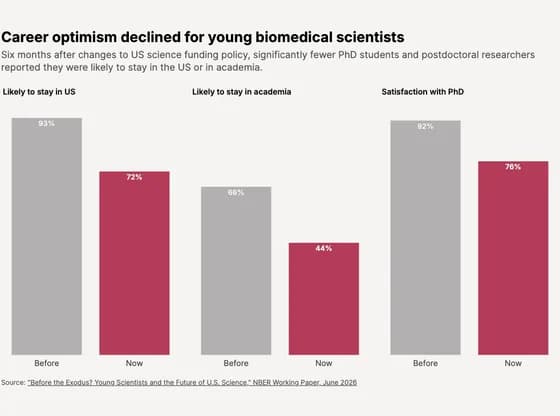 Line, bar and pie chartsCareer optimism declined for young biomedical scientists
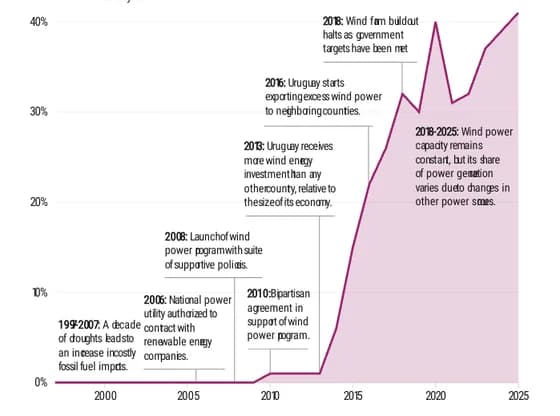 Interactive SVGIn Uruguay, bipartisan agreement spurs leap in wind power
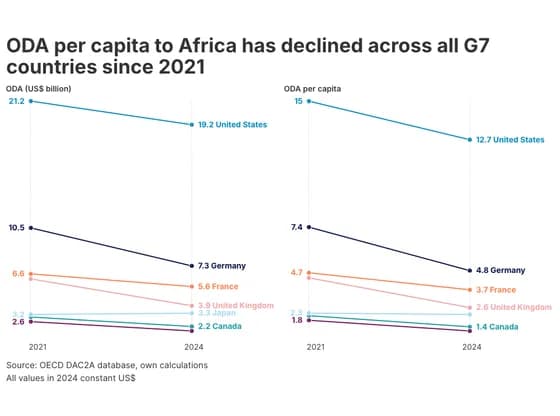 Slope chartODA per capita to Africa has declined across all G7 countries since 2021
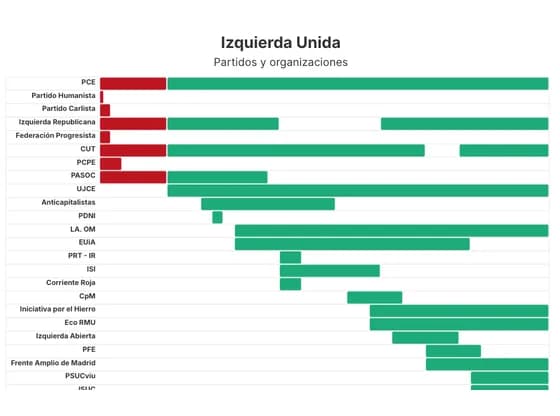 Gantt chartIzquierda Unida
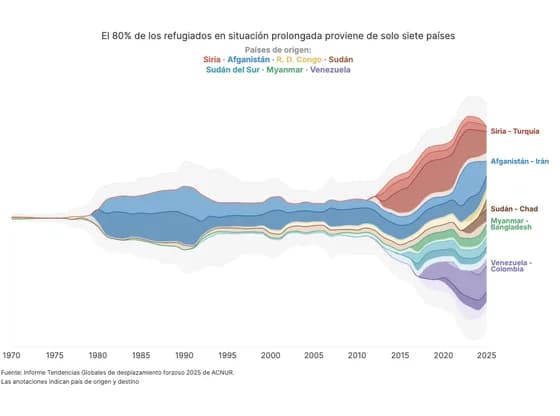 Line, bar and pie chartsEl 80% de los refugiados en situación prolongada proviene de solo siete países