
How to Create a Circle Packing Chart
Create a circle packing chart step by step, using NASA's sunlight-intensity data for the eight planets. Free, interactive, and embeddable.
5 min de lectura
Create a circle packing chart step by step, using NASA's sunlight-intensity data for the eight planets. Free, interactive, and embeddable.
5 min de lectura
Learn how to design a Voronoi Treemap for NBA Championships with this informative blog post. Perfect for data visualization enthusiasts.
4 min de lectura
Find out how to set up the 'Pie' Settings in Pie Charts and Donut Charts.
3 min de lectura
Learn how to create a treemap with categories on Big Pharma. Follow the steps and master the technique.
4 min de lectura
Discover the process of forking a shared chart with our comprehensive guide.
2 min de lectura
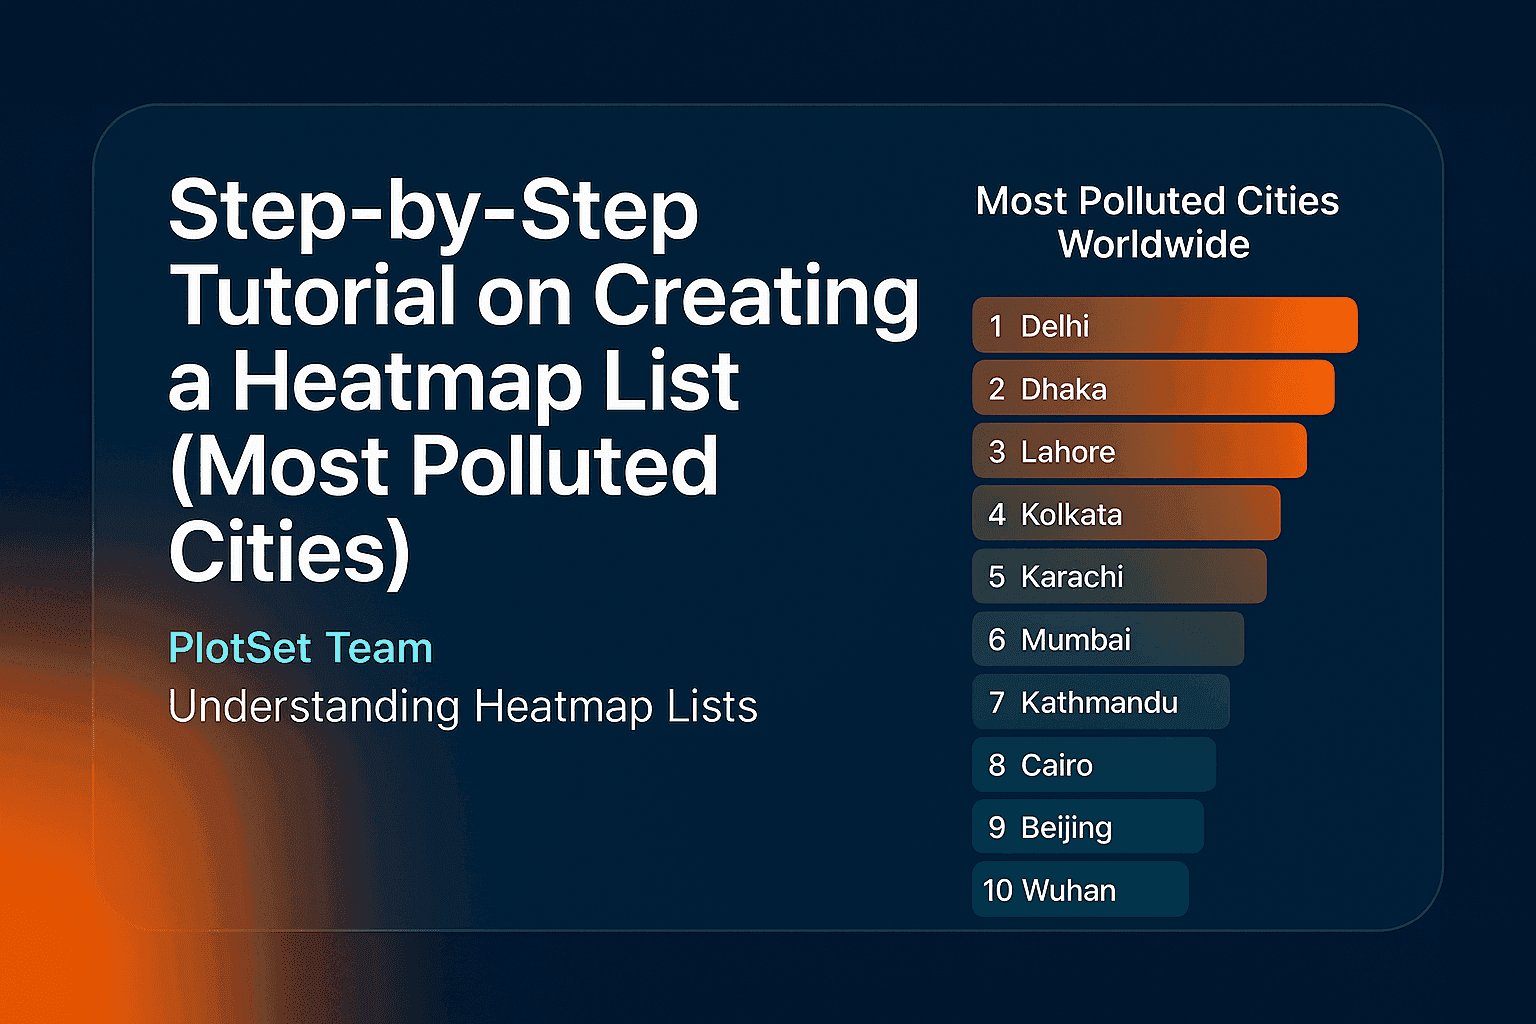
Make a heatmap list step by step, using World Bank PM2.5 data for the 12 most polluted countries. A ranked, colour-coded list with flags, free and embeddable.
5 min de lectura
Discover the significance of data visualization in gaining valuable customer insights. Enhance your business strategies with effective data representation.
2 min de lectura
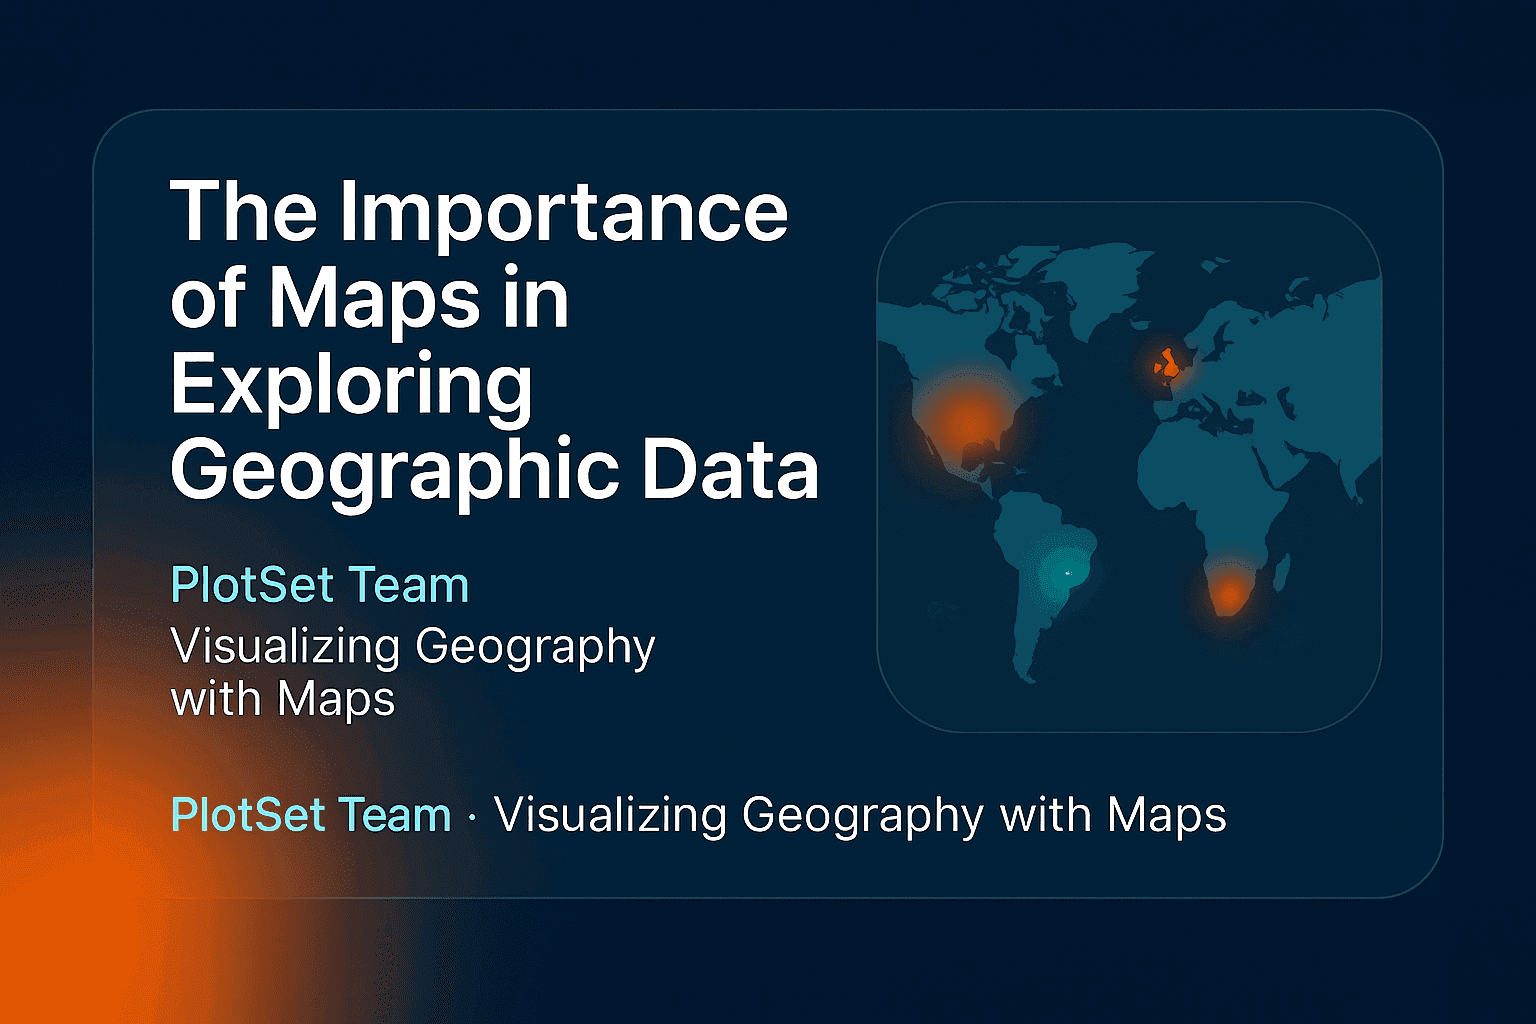
Explore geographic data with ease using interactive maps. Discover insights and trends with our informative blog.
3 min de lectura
Discover the intricacies of designing a Column Chart with the help of the Columns Settings. Enhance your data visualization skills today.
3 min de lectura
Learn how to create a detailed USA map using the PlotSet template with our comprehensive guide. Perfect for data visualization and presentations.
4 min de lectura
Discover the importance of using Footer to enhance the credibility and context of your data. Gain valuable insights and improve your data presentation skills.
4 min de lectura
Learn how to optimize your chart's header for better data visualization and analysis.
2 min de lectura