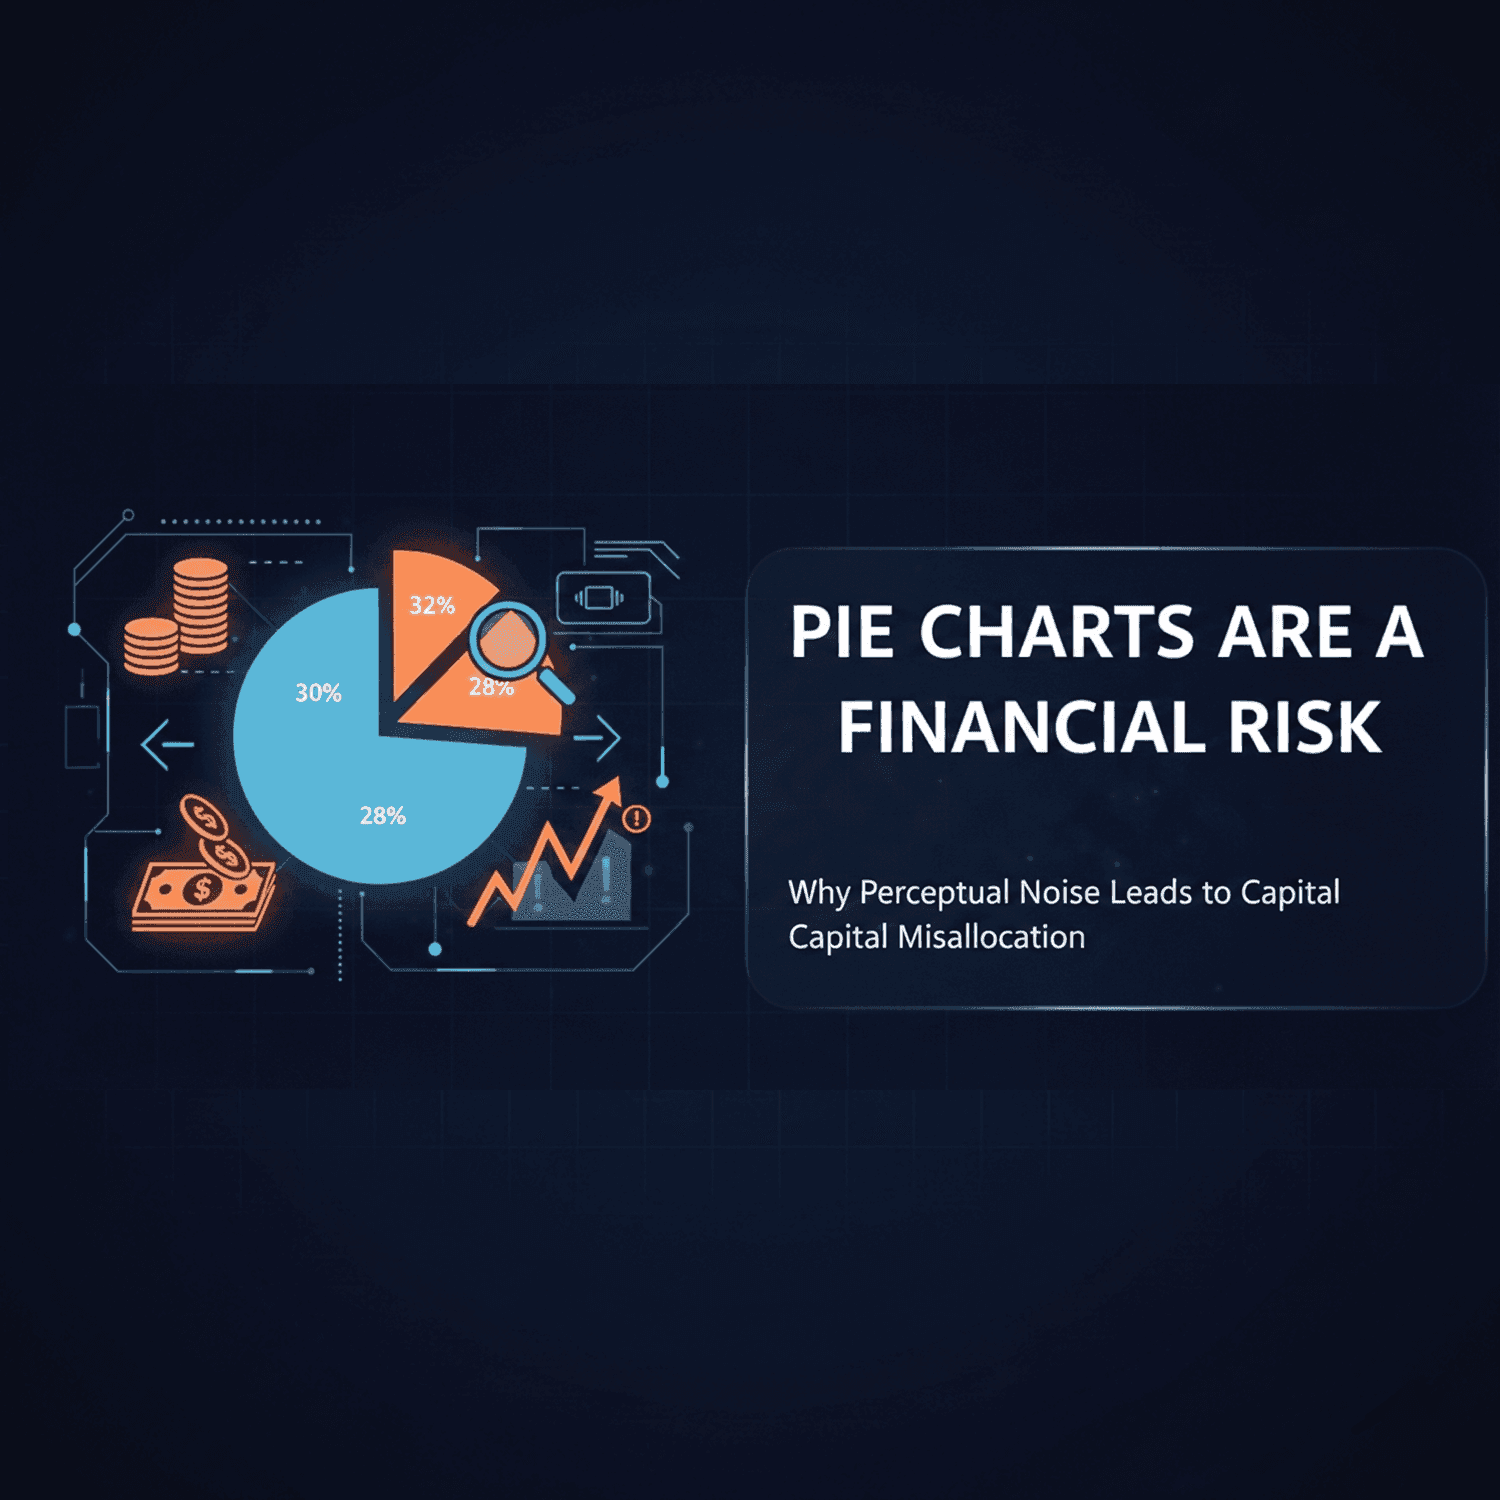
Are pie charts bad? Not always, but they are the wrong chart whenever a decision depends on small differences between slices. People judge angles and areas less accurately than lengths on a shared scale, so two slices of 30% and 32% look the same in a pie and obviously different in a bar chart. When a few percentage points decide where money goes, that misreading has a cost.
Are pie charts bad for comparing values?
Yes. Pie charts are bad for comparing values that are close together, because readers estimate angles and areas less precisely than positions or lengths. They work for one simple message, such as one part being about half or a quarter of the whole. For ranking or comparing several similar shares, a sorted bar chart is more accurate.
The research behind the perceptual ranking
In 1984 William Cleveland and Robert McGill ran controlled experiments in which people estimated values from different chart encodings. They found a consistent order of accuracy. From most to least accurate, the encodings that matter for everyday charts are:
- Position along a common scale (dot plots, aligned bars)
- Length (bars that do not share a baseline)
- Angle and slope (pie slices)
- Area (bubbles, treemap tiles)
Jeffrey Heer and Michael Bostock repeated these experiments with hundreds of online participants in 2010 and found the same ranking. Later work by Robert Kosara and Drew Skau (2016) suggests that readers judge pie slices from their area and arc length more than from the angle itself, which does not make the pie any more precise.
The evidence is not all one-sided. Spence and Lewandowsky (1991) found that pies hold up well when the question is how one part compares with the whole. The problem is comparing parts with each other, which is what most business charts ask people to do.
Try it: which slice is biggest?
Below is a market share split for three product lines and a group of smaller ones. The numbers are a made-up example. Without hovering, decide which product line leads and which is second.
Most people hesitate. Products A, B and C hold 32%, 30% and 28%, a two-point gap between each, and the slices look nearly identical. Now the same four numbers as a bar chart:
The order is obvious at once, because the bars start from the same baseline and the eye only has to compare their ends. That is the whole argument: the data did not change, only the encoding did.
How a misread chart becomes a financial risk
Nobody misreads a pie chart so badly that a large decision flips. The risk is smaller and adds up over time:
- The encoding: a dashboard or slide shows close shares as angles or areas.
- The estimate: each reader's estimate of those shares gets less precise, so small gaps disappear or get reversed.
- The decision: in a fast review, the chart is the main input. Budget, headcount or attention follows the share that looked largest.
- The accumulation: repeated over many reviews, small misallocations add up.
If a two-point difference in market share moves a budget, the chart showing it has to make two points visible.
Pie chart vs bar chart: which to use
| Question the chart answers | Better choice |
|---|---|
| Is this one part roughly half, a quarter, a third of the whole? | Pie or donut chart |
| Which of these categories is largest, and by how much? | Sorted bar chart |
| How do shares compare across several regions or years? | Stacked or grouped bar chart |
| How does a share split into sub-shares? | Treemap or stacked bar |
| Do the categories differ by less than about five points? | Bar chart or dot plot, never a pie |
Four rules for executive charts
1. The precision rule. If a decision depends on differences of five percentage points or less, put the values on a shared scale with a bar chart maker. Our guide to creating a bar chart covers sorting and labels.
2. The comparison rule. Do not put several pies side by side to compare regions or years. One stacked bar chart with a shared baseline makes the same comparison readable.
3. The annotation rule. If you do use a pie, label every slice with its exact percentage and keep it to five or six slices. Labels reduce the reliance on angle, they do not remove it. The pie chart maker shows labels on the slices, and the pie chart guide walks through rolling small categories into Other.
4. The template rule. Make bar charts the default in dashboard and slide templates, and keep pies and donut charts for the simple part-of-a-whole message they are good at. Labelling the data directly also helps readers with low vision, see our rules for accessible data visualization.
FAQ
Why are pie charts considered bad?
Because people read angles and areas less accurately than lengths and positions. Cleveland and McGill's 1984 experiments, repeated by Heer and Bostock in 2010, rank angle and area below position on a common scale, so close shares are hard to compare in a pie.
When is it OK to use a pie chart?
When there are only a few slices and the message is about one part of the whole, such as "renewables are about a third of the mix". Label each slice with its percentage and make sure the slices add up to 100%.
Is a donut chart better than a pie chart?
Not much. Research by Kosara and Skau found that readers judge donut and pie charts with similar accuracy. A donut does leave room for a total in the middle, which can be useful.
What should I use instead of a pie chart?
A sorted bar chart in most cases. For shares across several groups use a stacked bar chart, and for nested categories use a treemap.
How many slices should a pie chart have?
Five or six at most. Group the smallest categories into one Other slice and say what it contains in a note.
Sources
- Cleveland, W. S. and McGill, R. (1984). Graphical Perception: Theory, Experimentation, and Application to the Development of Graphical Methods. Journal of the American Statistical Association, 79(387), 531-554.
- Heer, J. and Bostock, M. (2010). Crowdsourcing Graphical Perception: Using Mechanical Turk to Assess Visualization Design. Proceedings of CHI 2010.
- Kosara, R. and Skau, D. (2016). Judgment Error in Pie Chart Variations. EuroVis 2016 short papers.
- Spence, I. and Lewandowsky, S. (1991). Displaying Proportions and Percentages. Applied Cognitive Psychology, 5(1), 61-77.