or twenty years the entire discipline of vulnerability management rested on one instruction: patch quickly. A flaw gets disclosed, a fix ships, and defenders race attackers to install it before the exploit arrives. The whole model assumes the exploit comes after the patch.
In 2025 that assumption inverted. According to Google Mandiant's M-Trends 2026 report, the average time-to-exploit, the number of days between a vulnerability becoming known and the first attack using it, fell to an estimated negative seven days. On average, exploitation now begins about a week before the vendor's patch even exists. The metric did not shrink toward zero. It crossed it.
The line that went below zero
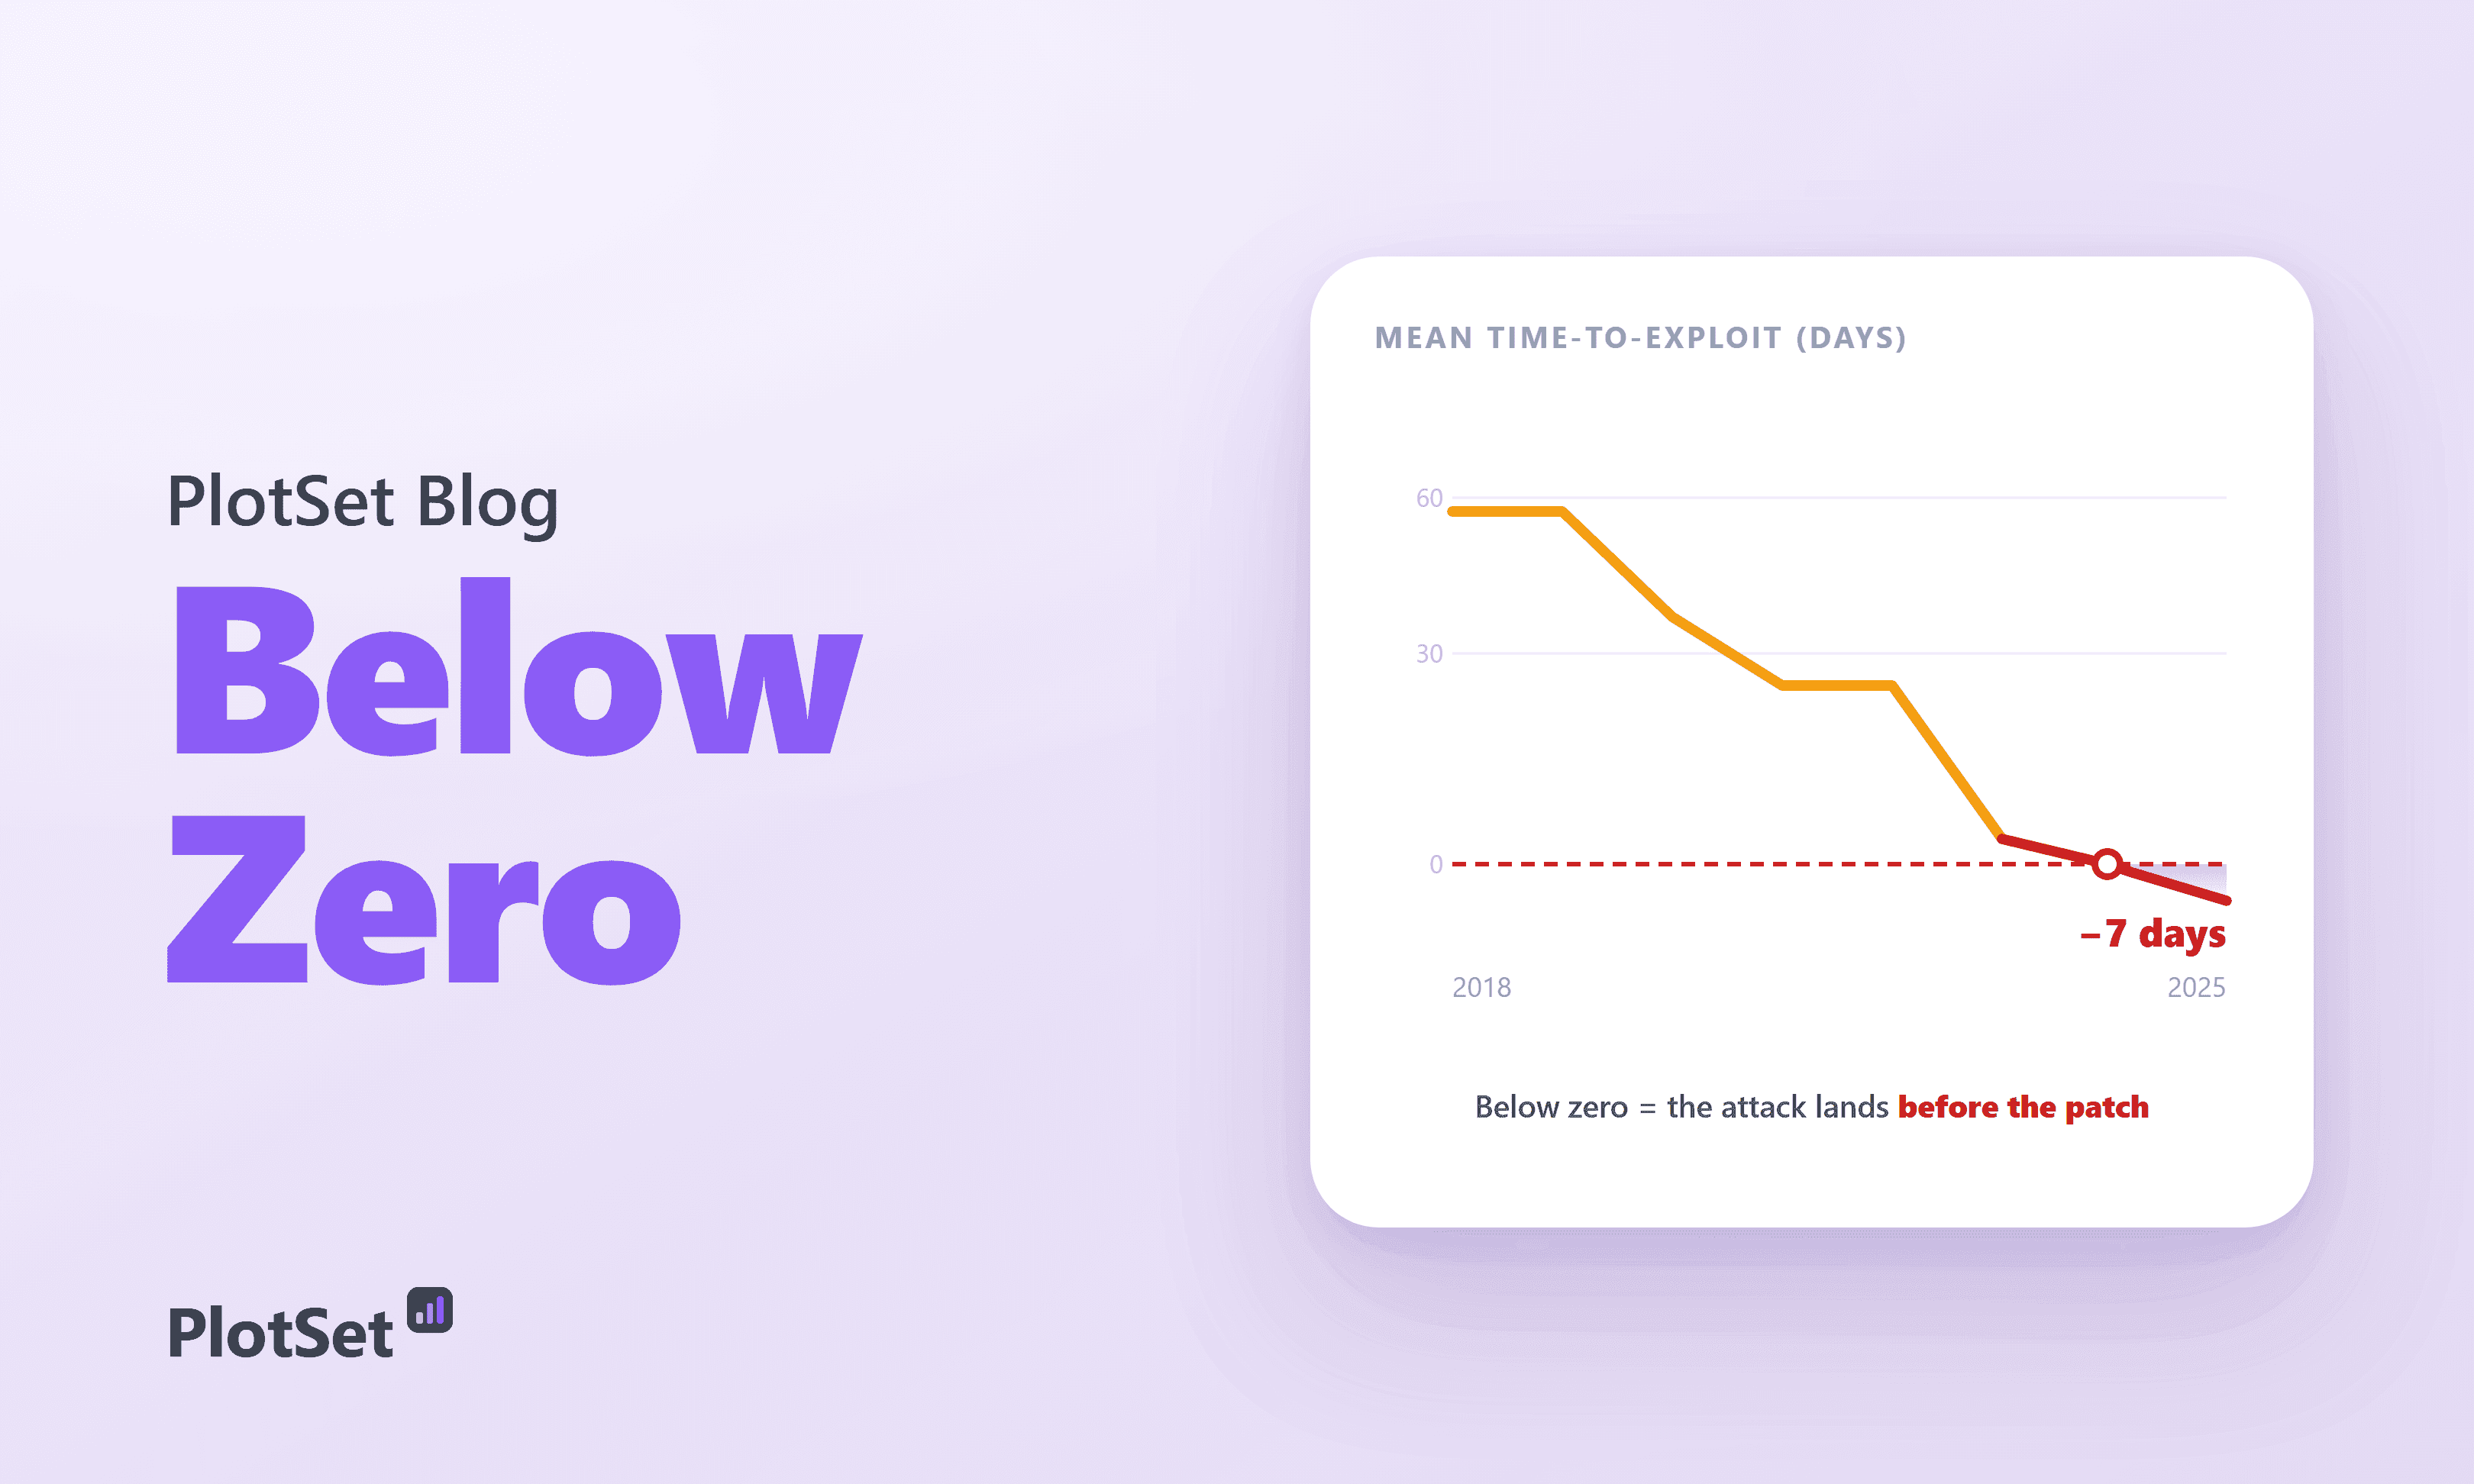
Mandiant has tracked this figure for years, and the trajectory is a straight walk off a cliff. It sat at 63 days in 2018-2019 , fell to 44, then 32, then to just 5 days in 2023. In 2024 it went to minus one, its first negative reading. In 2025, minus seven.
That is the chart almost nobody has drawn, even though the number is everywhere in security trade press. A line that spends six years falling and then keeps going, straight through the zero axis. The moment it dips below the line, the defender's core assumption is dead: you cannot install a patch that has not been written yet.
The 2025 mean time-to-exploit. On average, exploitation now begins about a week before the vendor's patch is published. The metric first crossed zero in 2024.— −7 days
What a negative average does and does not mean
Before we sound every alarm, the honest part, because this is exactly where a scary chart can lie. Every number above is a mean, an outlier-trimmed average, never a median. That distinction carries the whole story. Mandiant's own 2023 figure was 5 days trimmed but 47 days without trimming: a handful of extreme cases drag the average around violently.
And the thing dragging it below zero is zero-days. In 2023, 70 percent of the vulnerabilities Mandiant saw exploited were hit as zero-days, before any patch existed, and a few were exploited for hundreds of days beforehand. Those deeply negative cases pull the mean under water. It does not mean every flaw is now hit pre-patch. Most ordinary vulnerabilities are still exploited days-to-weeks after the fix ships. A broader dataset from VulnCheck, covering 884 exploited vulnerabilities in 2025, found that 28.96 percent were exploited on or before their disclosure day, a large minority that has been remarkably stable at roughly a quarter to a third for three years. So the accurate reading of the "time to exploit negative" headline is this: in the highest-value cases the attacker now arrives before the defender has anything to install, and pre-patch exploitation is common enough to have flipped the average.
The rap sheet
Abstractions dissolve when you look at the actual vulnerabilities. Sort the table below by time-to-exploit and the pattern is brutal: almost every landmark breach of the last five years was a zero-day, exploited before the world knew the hole existed.
Barracuda's email gateway was quietly exploited for about 225 days before disclosure. Log4Shell had attackers testing it before the announcement, and then mass exploitation began nine minutes after the public disclosure. MOVEit, Ivanti, Citrix Bleed, PAN-OS, SharePoint's ToolShell: all exploited before a fix was available. The positive numbers in that table, the ordinary flaws exploited weeks later, are now the exception in the headline cases, not the rule.
The whole window is closing, not just the zero-days
Even the boring middle of the distribution is collapsing. Flashpoint, which averages the disclosure-to-exploitation gap across all vulnerabilities rather than a curated sample, measured that window at 745 days in 2020. By 2025 it was 44 days, a 94 percent collapse in five years.
That 745-day figure is the one often misquoted as the negative-going metric, but it is a different series measuring a different thing, and it never goes negative. What both agree on is direction: the comfortable months defenders once had have compressed to days, and for the worst cases, to less than zero. Feeding the trend is a rising baseline of zero-day discovery. Google's threat group counted 90 zero-days exploited in the wild in 2025, up from a couple dozen at the start of the decade, though some of that rise reflects better detection rather than pure growth in attacker activity.
A race that no longer has two runners
Set the attacker's clock next to the defender's and the problem stops being subtle.
The attacker side of that chart clusters around zero. The defender side does not. The median organization takes 32 days to remediate even the edge-device flaws on CISA's known-exploited list, 43 days for known-exploited flaws generally, and across 1.4 million organizations the median time to resolve a listed vulnerability is 174 days.
When the attacker arrives at day minus seven and the defender arrives at day 174, "patch faster" is not a strategy. It is arithmetic that cannot be won.
The response: from 14 days to 3
Regulators noticed. On May 1, 2026, Reuters reported that CISA was weighing a cut to its patch deadline, and six weeks later it happened: Binding Operational Directive 26-04 replaced the old 14-day default with a 3-day deadline for the most dangerous class of flaws: actively exploited, automatable, and internet-facing. The trigger it named was AI-accelerated exploitation, and the research backs the worry: given a vulnerability's description, GPT-4 agents could autonomously exploit 87 percent of tested one-day flaws, a rate that collapsed to 7 percent without the write-up, a reminder that AI is far better at weaponizing disclosed bugs than discovering new ones.
Even a 3-day deadline sits on the wrong side of a minus-seven-day average. That is the uncomfortable conclusion security leaders have reached: when exploitation routinely beats the patch, patching stops being a shield and becomes cleanup. The strategies that actually address a negative time-to-exploit are the ones that assume the breach already happened: virtual patching and shielding at the network layer, exploitation detection rather than prevention, and architectures that limit what a first foothold can reach.
The metric that went negative is not really a patching statistic. It is the moment an entire defensive philosophy quietly expired.
Sources & further reading
- Google Mandiant. M-Trends 2026. Mean time-to-exploit estimated at -7 days for 2025; dwell time 14 days.
- Mandiant. Analysis of Time-to-Exploit Trends 2021-2022. The 63/44/32-day series.
- Mandiant. How Low Can You Go? An Analysis of 2023 Time-to-Exploit. 5 days trimmed vs 47 untrimmed; 70% zero-day mix.
- VulnCheck. State of Exploitation 2026. 28.96% of 884 KEVs exploited on or before CVE publication day.
- Flashpoint. N-Day Vulnerability Trends: The Shrinking Window of Exposure. Average disclosure-to-exploitation fell from 745 days (2020) to 44 (2025).
- Google Threat Intelligence Group. Look What You Made Us Patch: 2025 Zero-Days in Review. 90 zero-days exploited in the wild in 2025.
- Mandiant. Barracuda ESG Exploited Globally. CVE-2023-2868 exploited ~225 days pre-disclosure.
- Cloudflare. Exploitation of CVE-2021-44228 before public disclosure. Log4Shell pre-disclosure testing and 9-minute mass exploitation.
- CISA. Binding Operational Directive 26-04: Prioritizing Security Updates Based on Risk. The new 3-day remediation deadline (June 10, 2026).
- CISA. Binding Operational Directive 22-01: Reducing the Significant Risk of Known Exploited Vulnerabilities. The prior 14-day default, now revoked.
- GreyNoise. Verizon DBIR 2025: Edge KEVs Increasingly Left Unpatched, Exploited. Median remediation of 32-43 days.
- Bitsight. More Than 60% of Known Exploited Vulnerabilities Remain Unmitigated. 174-day median resolution across 1.4M+ organizations.
- Fang et al. LLM Agents Can Autonomously Exploit One-day Vulnerabilities. 87% success with the CVE description, 7% without.


