MarimekkoKostenlos
Marimekko chart
Erstellen Sie ein Marimekko-Diagramm in PlotSet: Starten Sie mit dieser Vorlage, setzen Sie Ihre eigenen Daten ein und betten Sie es ein oder exportieren Sie es als PNG, SVG oder PDF.
(Keine Kreditkarte erforderlich)
Anwendungsfälle
Wo ein solches Diagramm am besten wirkt.
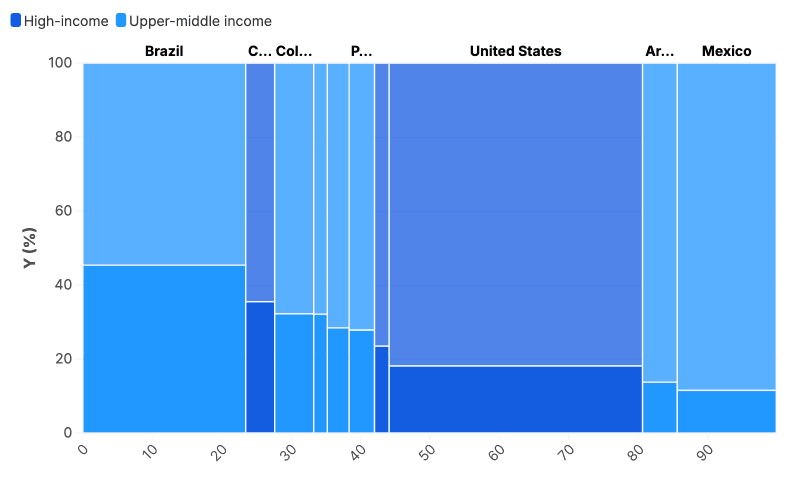
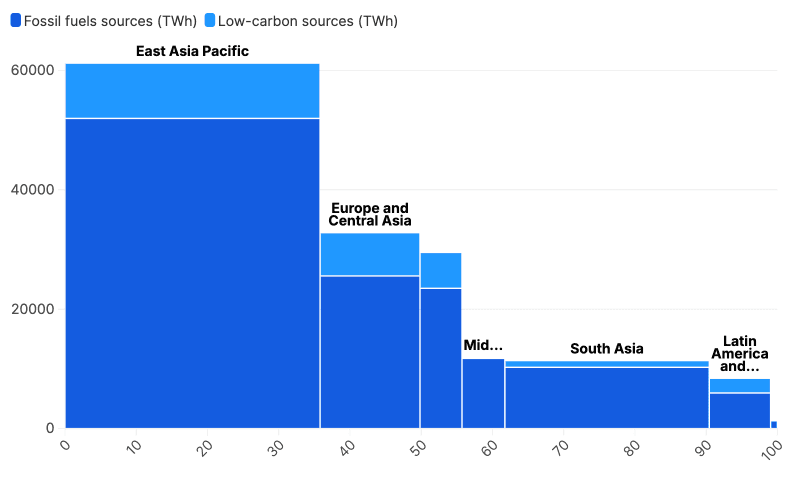
Marktanteil nach Region und Unternehmen
Umsatz nach Segment und Produktlinie
Budgetaufteilung auf Abteilungen
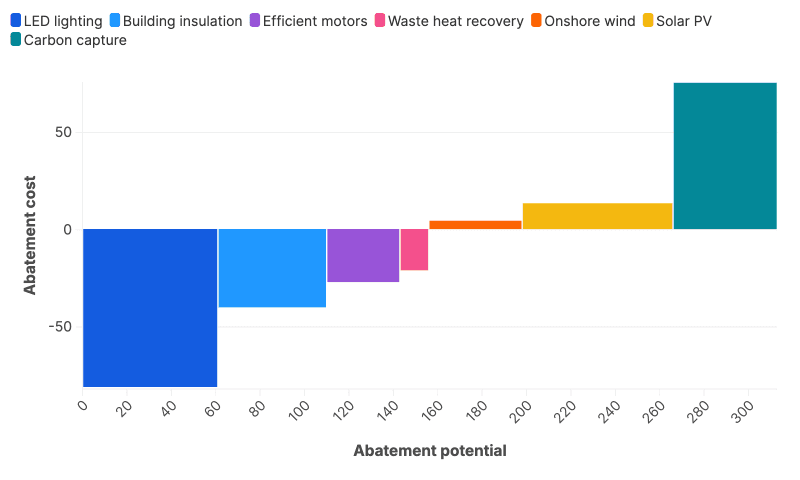
Kostenkurven mit variablen Breiten
Mit einem Beispiel starten
Wählen Sie eines aus, um Ihre eigene bearbeitbare Kopie zu öffnen.
 EU hydro giants can install 18% of their planned renewables using grid connections of existing…
 WDRC - LGA Miko
 Proporción de narrativas eco por medio muestreado
 Belgian population by country of birth and nationality in 2022
 In countries with growing electricity demand, most growth is met by clean electricity
 Road transport is heavily reliant on imported fossil-fuels
 EU countries have slowed in their transition to greener electricity as Germany opens new coal…
 Every major sector of the EU economy is reliant on imported fossil fuels, especially transport
 The EU is more reliant on fossil imports than other major economies
 SPACE COMPANIES RAISE $7.8 BILLION IN Q2
 Flaring and flaring intensity by assets in 2024
 Position of private renters on rent distribution by share of housing costs to income and whether…