
Jedes Diagramm hier war zuerst eine Tabelle.
Karten, Bar-Chart-Races, Treemaps, Piktogramme und mehr. Eines öffnen und mit eigenen Daten nachbauen.
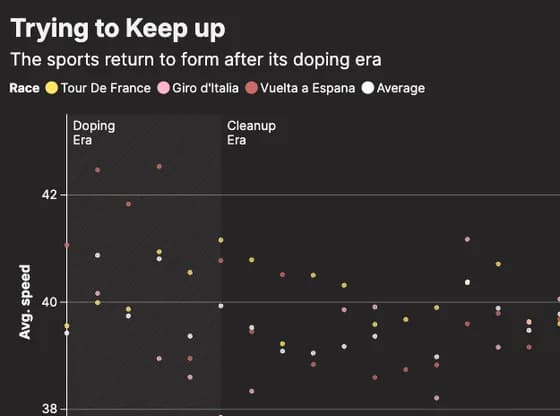 ScatterTrying to Keep up
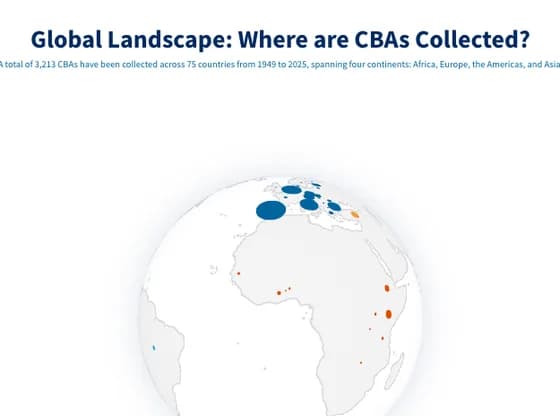 3D globeGlobal Landscape: Where are CBAs Collected?
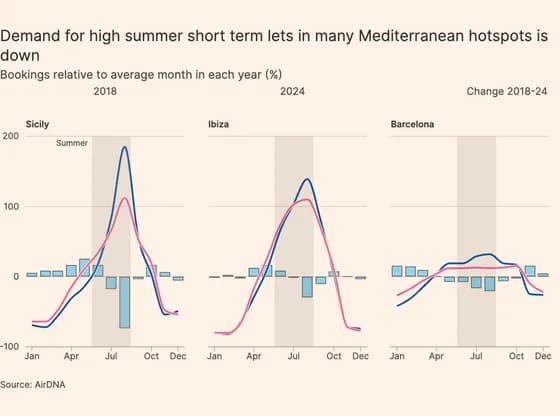 Line, bar and pie chartsDemand for high summer short term lets in many Mediterranean hotspots is down
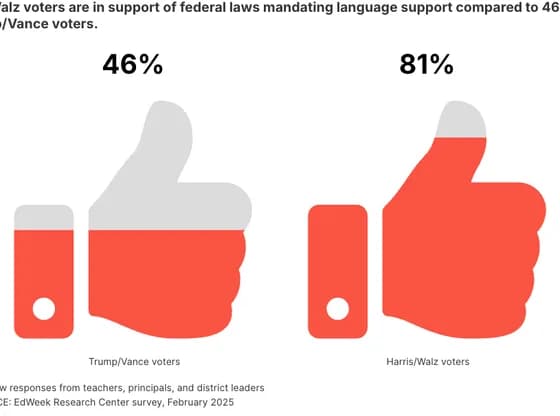 PictogramAmong educators who serve neither foreign-born nor English-learner students, 81 percent of…
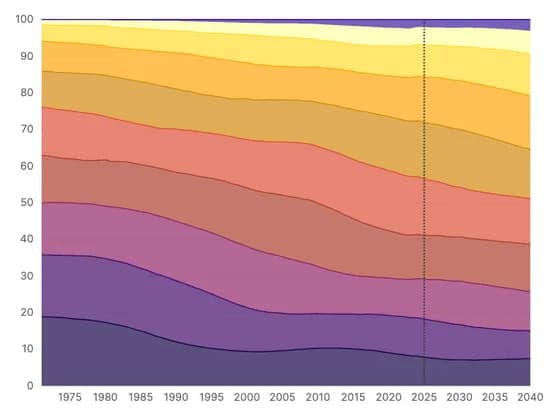 Line, bar and pie chartsFigura 4. Evolució de la població per grups d’edat (%), 1971-2040
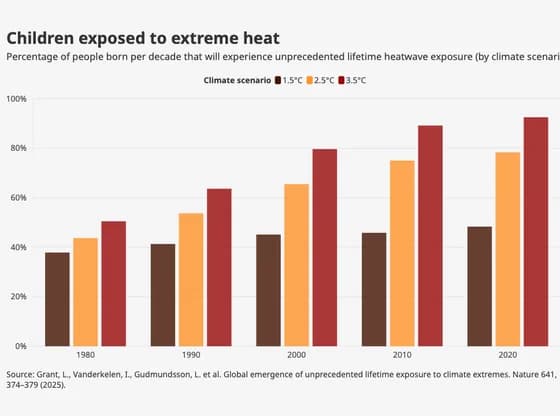 Line, bar and pie chartsChildren exposed to extreme heat
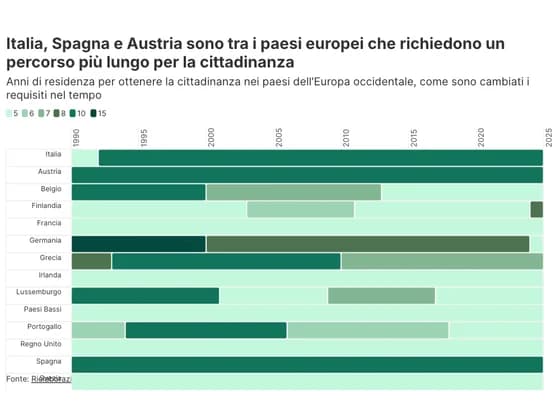 Gantt chartItalia, Spagna e Austria sono tra i paesi europei che richiedono un percorso più lungo per la…
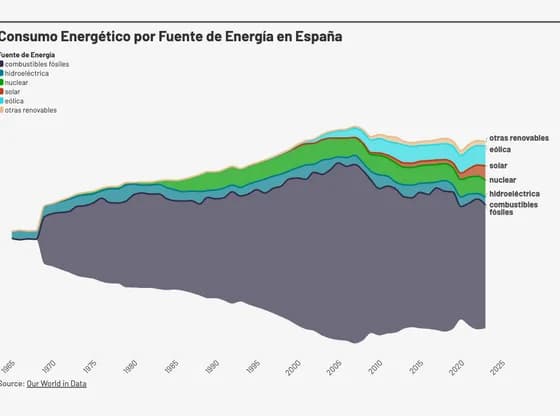 Line, bar and pie chartsConsumo Energético por Fuente de Energía en España
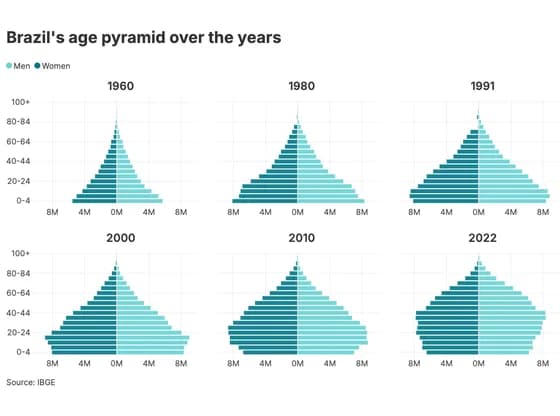 Line, bar and pie chartsBrazil's age pyramid over the years
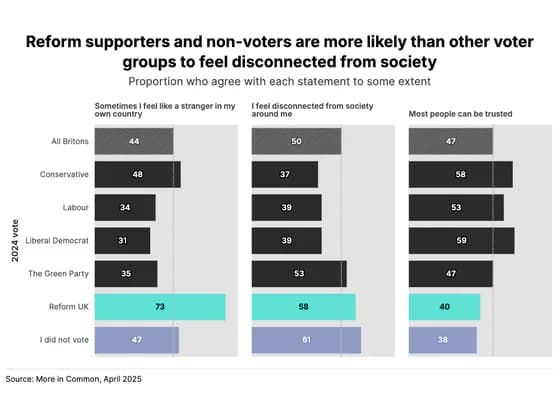 Line, bar and pie chartsReform supporters and non-voters are more likely than other voter groups to feel disconnected…
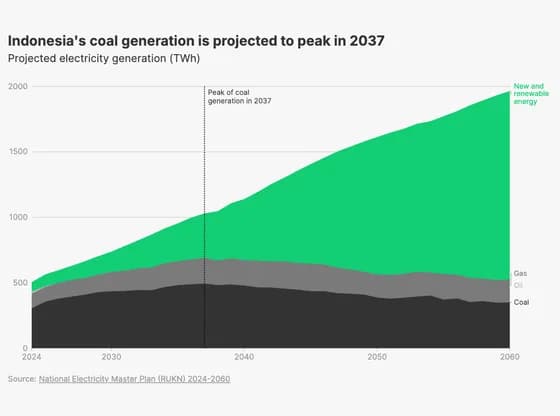 Line, bar and pie chartsIndonesia's coal generation is projected to peak in 2037
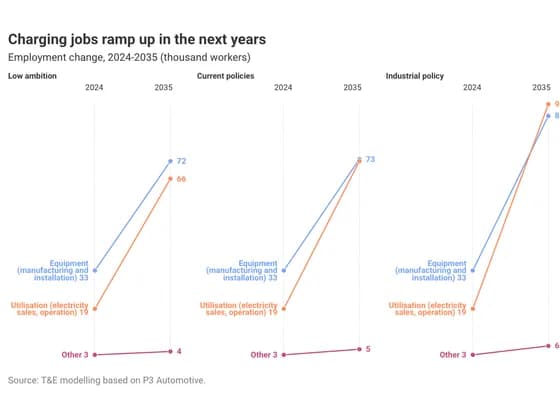 Slope chartCharging jobs ramp up in the next years
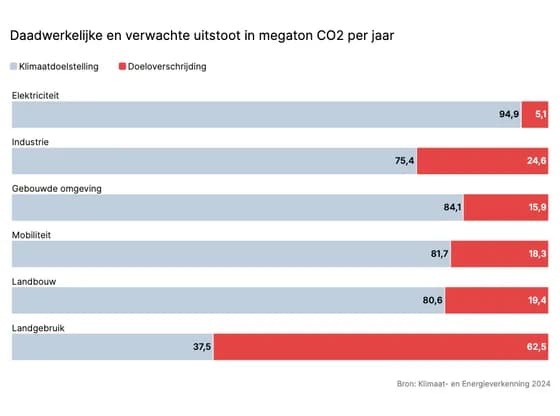 Line, bar and pie chartsDaadwerkelijke en verwachte uitstoot in megaton CO2 per jaar
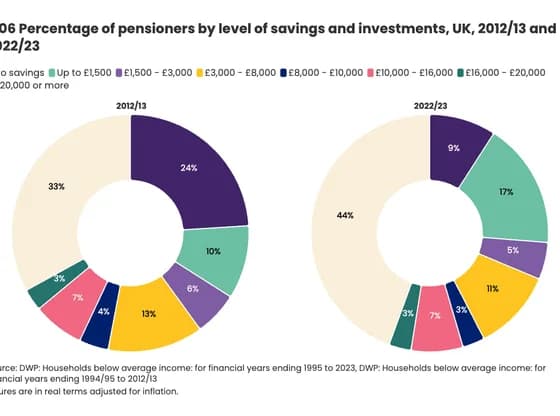 Line, bar and pie charts6.06 Percentage of pensioners by level of savings and investments, UK, 2012/13 and 2022/23
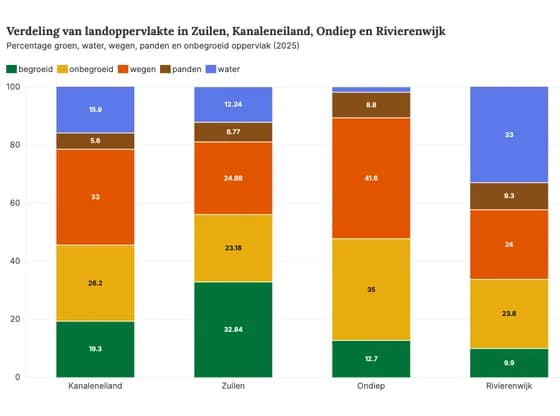 Line, bar and pie chartsVerdeling van landoppervlakte in Zuilen, Kanaleneiland, Ondiep en Rivierenwijk
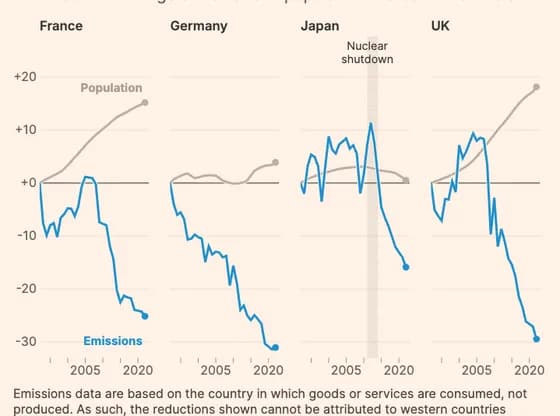 Line, bar and pie chartsCarbon emissions trajectories are shaped far more by innovation and policy than demographics
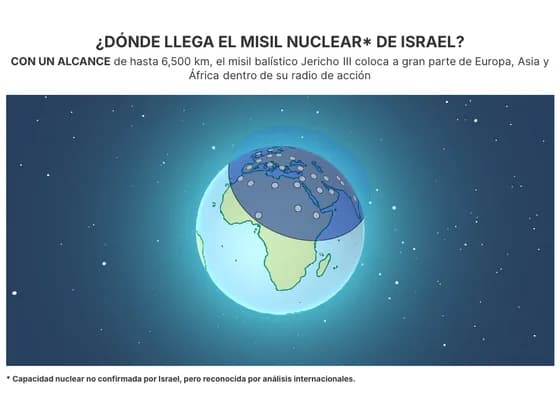 3D globe¿DÓNDE LLEGA EL MISIL NUCLEAR* DE ISRAEL?
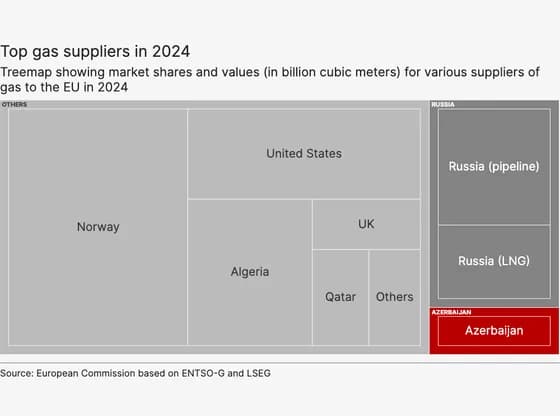 HierarchyTop gas suppliers in 2024
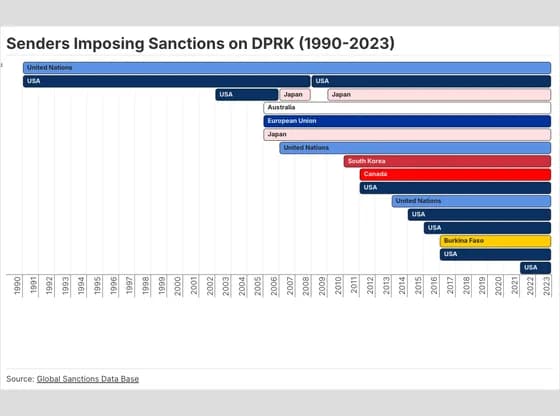 Gantt chartSenders Imposing Sanctions on DPRK (1990-2023)
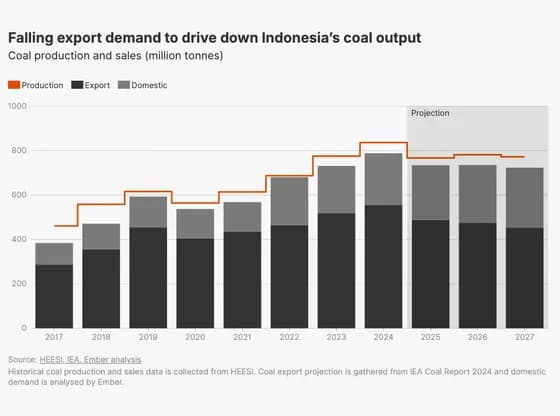 Line, bar and pie chartsFalling export demand to drive down Indonesia’s coal output