
Jedes Diagramm hier war zuerst eine Tabelle.
Karten, Bar-Chart-Races, Treemaps, Piktogramme und mehr. Eines öffnen und mit eigenen Daten nachbauen.
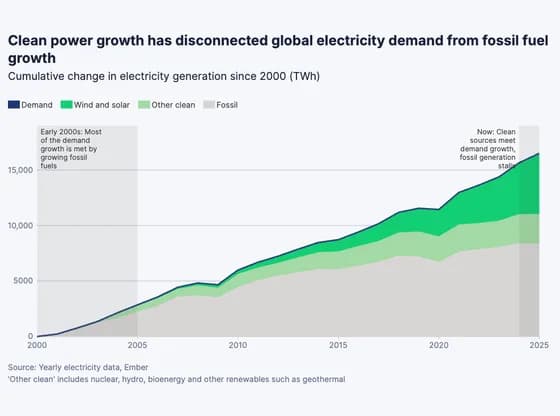 Line, bar and pie chartsClean power growth has disconnected global electricity demand from fossil fuel growth
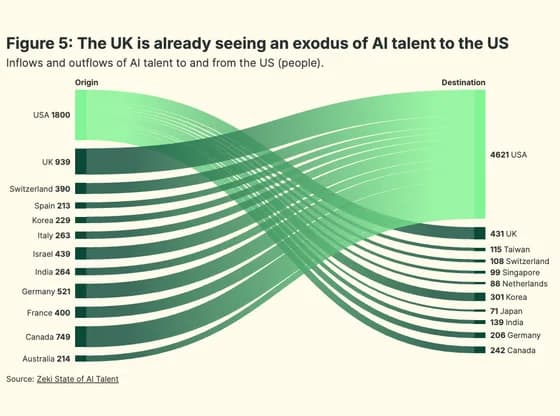 Sankey diagramFigure 5: The UK is already seeing an exodus of AI talent to the US
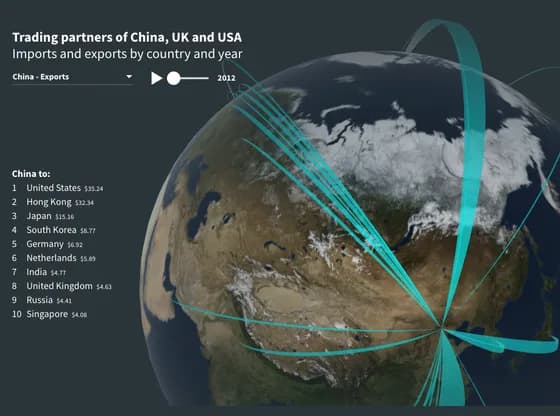 Connections and flow mapsTrading partners of China, UK and USA
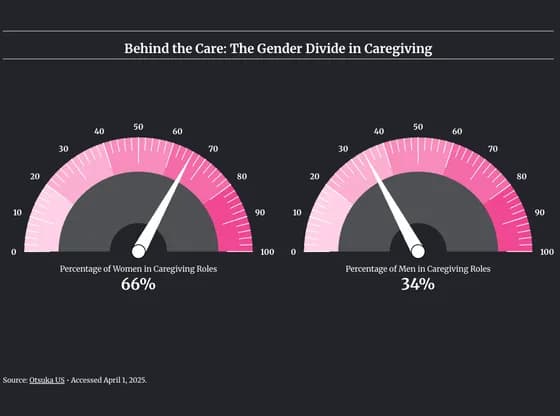 Counters and gaugesBehind the Care: The Gender Divide in Caregiving
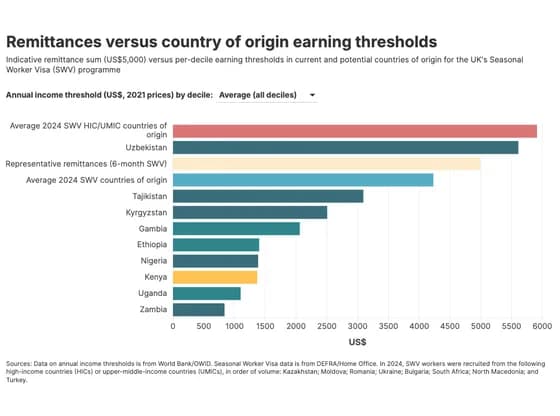 Line, bar and pie chartsRemittances versus country of origin earning thresholds
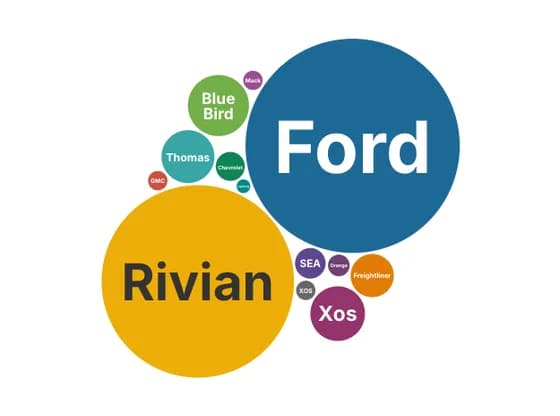 Distribution chartsRebates for truck electric vehicles by manufacturer, 2022–2025
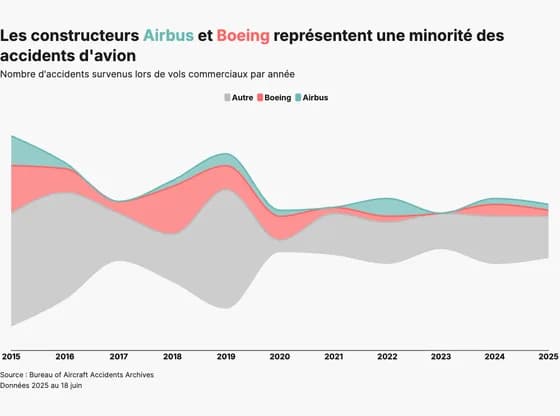 Line, bar and pie chartsLes constructeurs Airbus et Boeing représentent une minorité des accidents d'avion
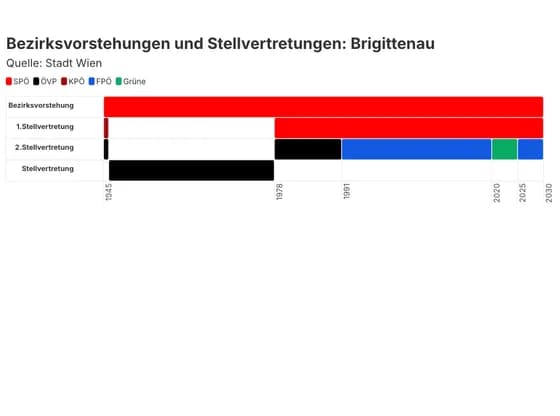 Gantt chartBezirksvorstehungen und Stellvertretungen: Brigittenau
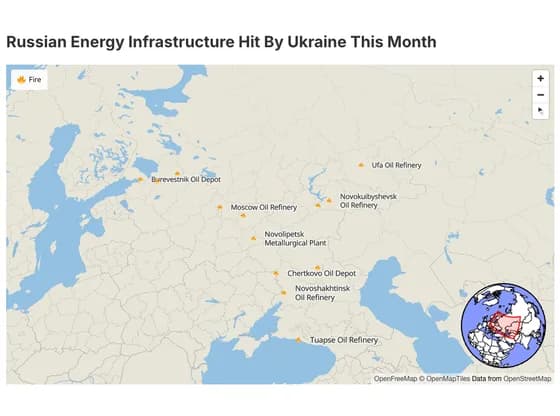 3D mapRussian Energy Infrastructure Hit By Ukraine This Month
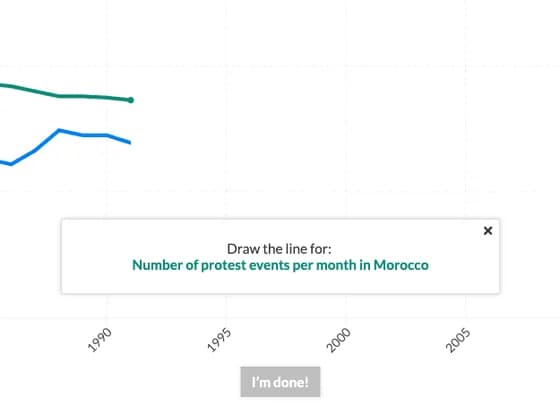 Interactive toolsDraw the line chart
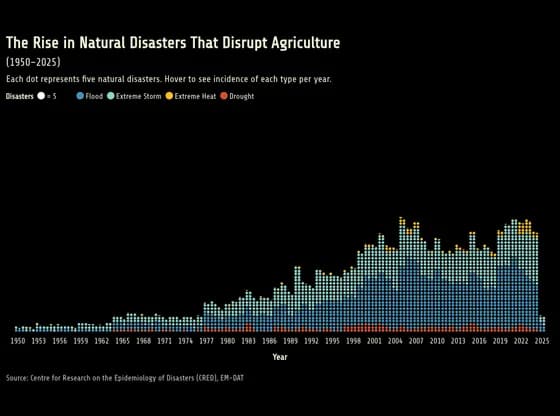 PictogramThe Rise in Natural Disasters That Disrupt Agriculture
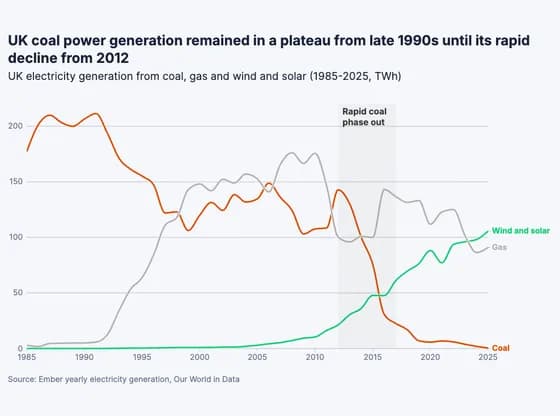 Line, bar and pie chartsUK coal power generation remained in a plateau from late 1990s until its rapid decline from 2012
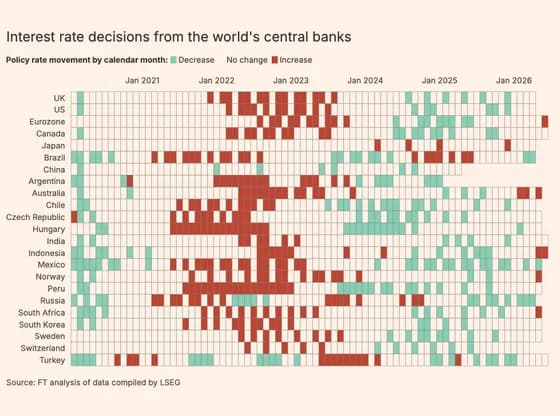 HeatmapInterest rate decisions from the world's central banks
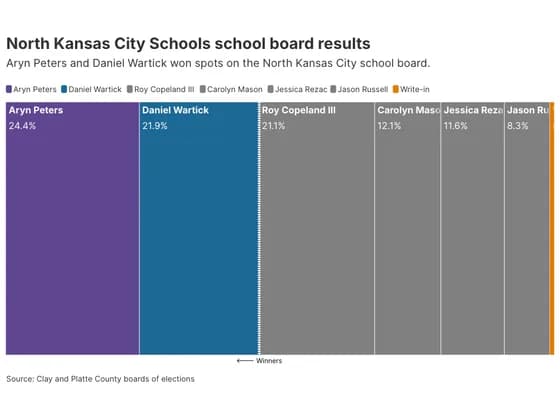 Elections and parliamentsNorth Kansas City Schools school board results
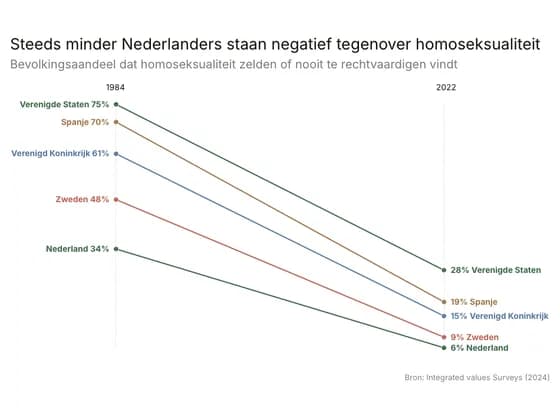 Slope chartSteeds minder Nederlanders staan negatief tegenover homoseksualiteit
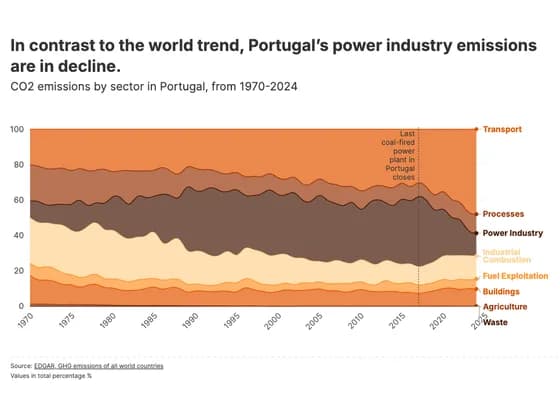 Line, bar and pie chartsIn contrast to the world trend, Portugal’s power industry emissions are in decline.
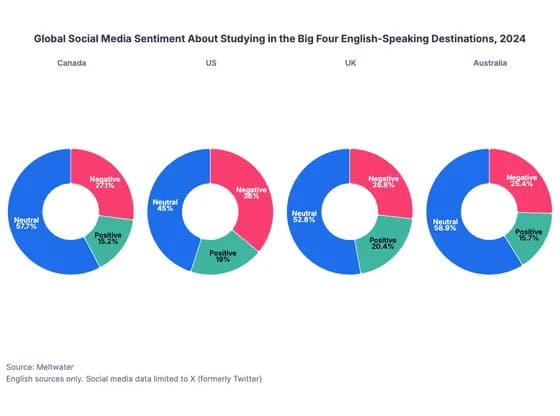 Line, bar and pie chartsGlobal Social Media Sentiment About Studying in the Big Four English-Speaking Destinations, 2024
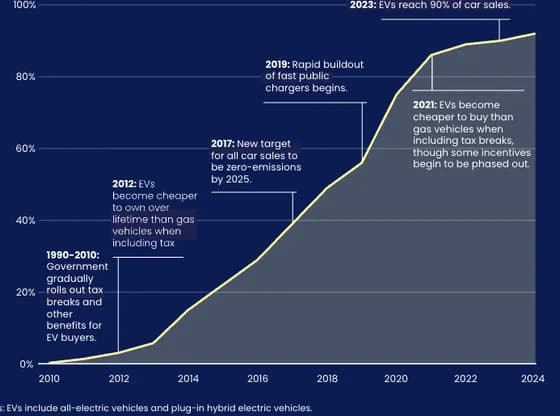 Interactive SVGNorway was the world's earliest EV champion
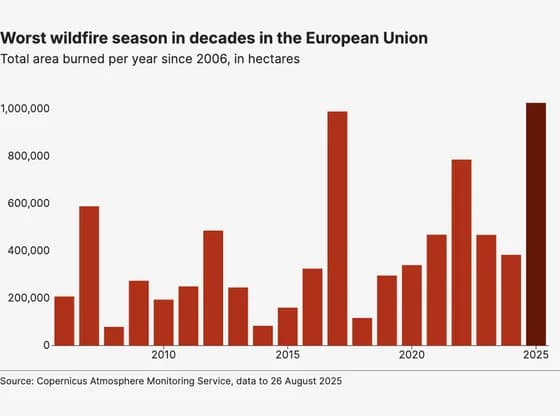 Line, bar and pie chartsWorst wildfire season in decades in the European Union
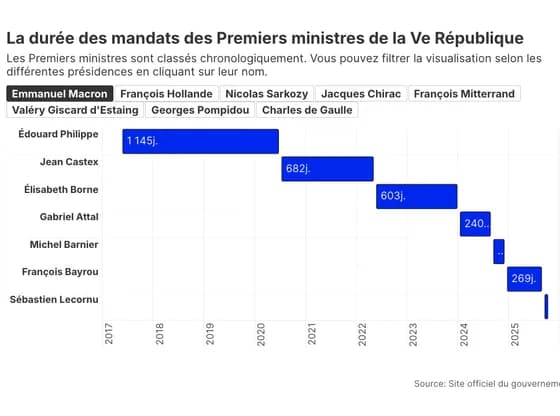 Gantt chartLa durée des mandats des Premiers ministres de la Ve République