
Jedes Diagramm hier war zuerst eine Tabelle.
Karten, Bar-Chart-Races, Treemaps, Piktogramme und mehr. Eines öffnen und mit eigenen Daten nachbauen.
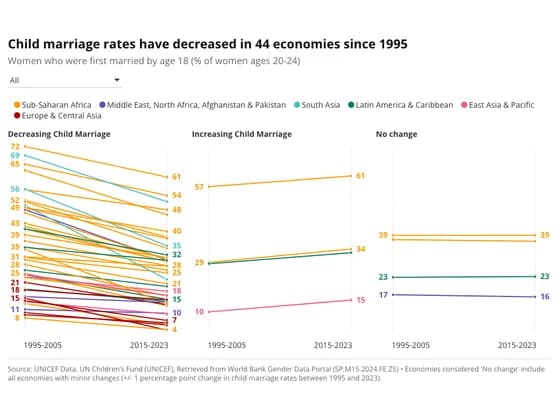 Slope chartChild marriage rates have decreased in 44 economies since 1995
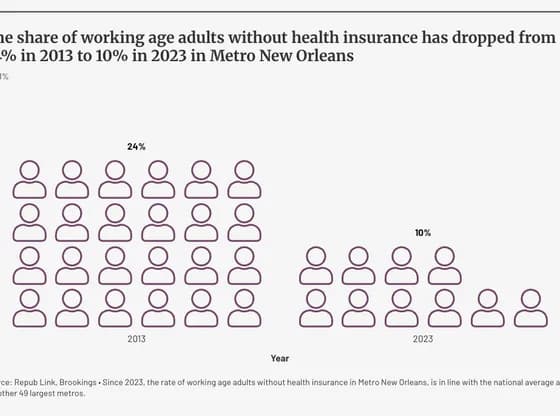 PictogramThe share of working age adults without health insurance has dropped from 24% in 2013 to 10% in…
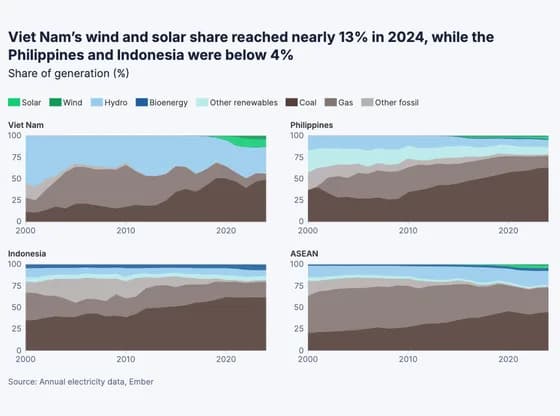 Line, bar and pie chartsViet Nam’s wind and solar share reached nearly 13% in 2024, while the Philippines and Indonesia…
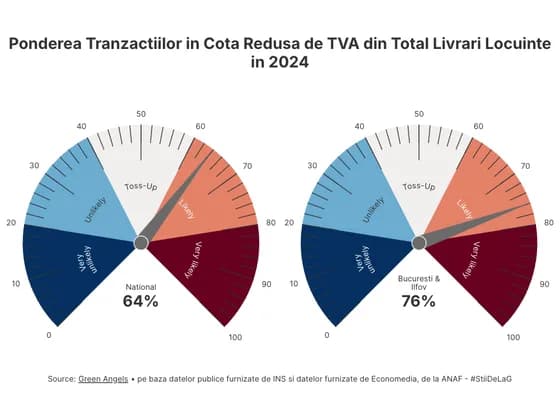 Counters and gaugesPonderea Tranzactiilor in Cota Redusa de TVA din Total Livrari Locuinte in 2024
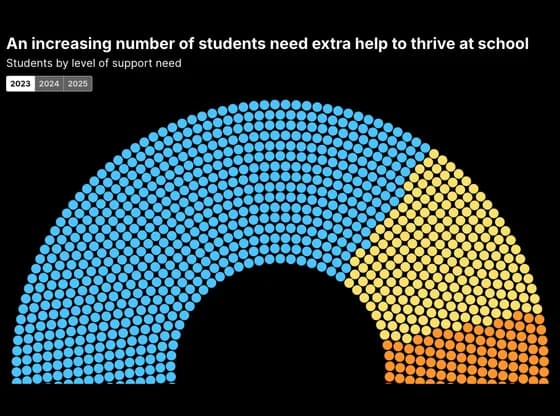 Elections and parliamentsAn increasing number of students need extra help to thrive at school
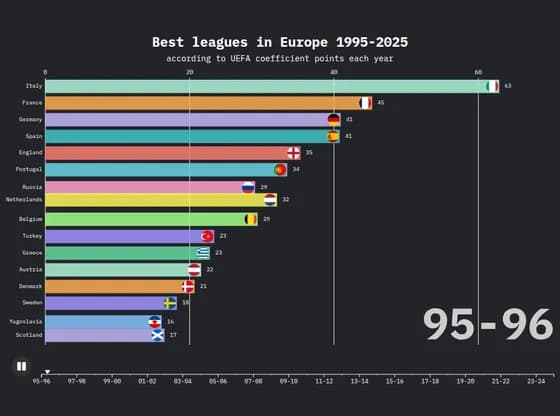 Animated chartsBest leagues in Europe 1995-2025
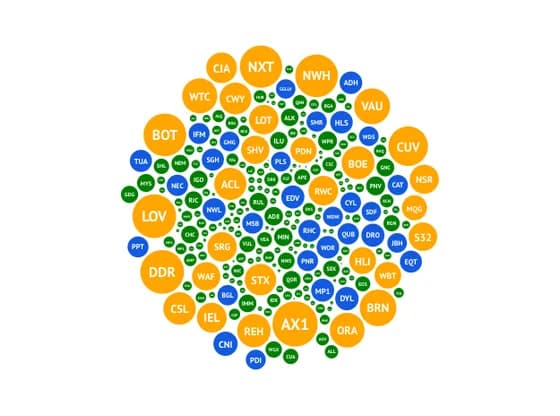 Distribution chartsThe 2025 AGM season
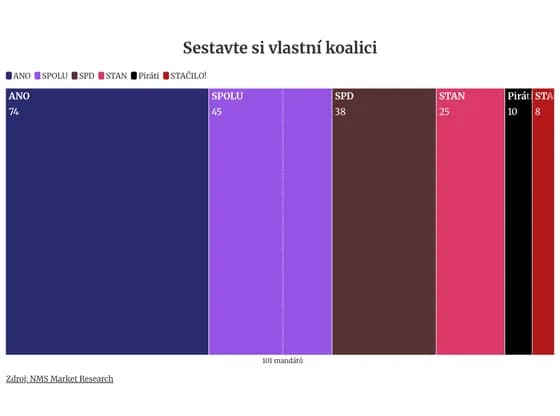 Elections and parliamentsSestavte si vlastní koalici
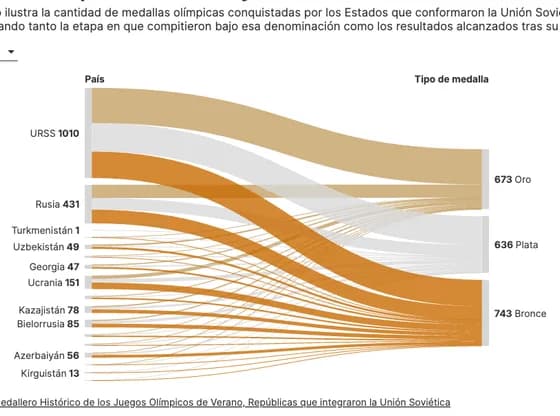 Sankey diagramMedallas olímpicas de la URSS y sus Estados sucesores
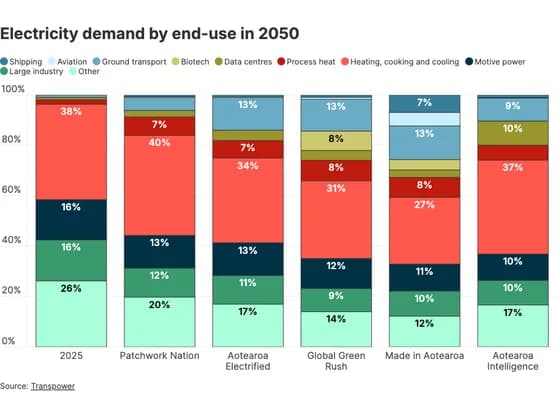 Line, bar and pie chartsElectricity demand by end-use in 2050
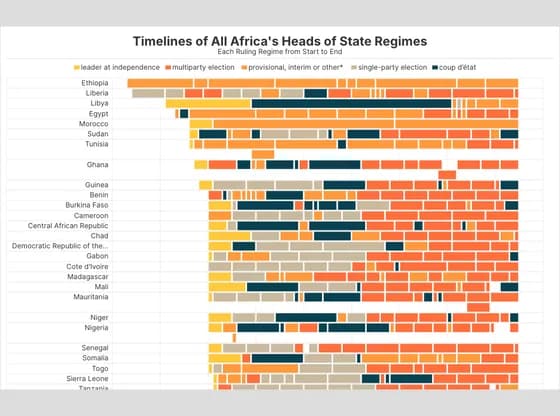 Gantt chartTimelines of All Africa's Heads of State Regimes
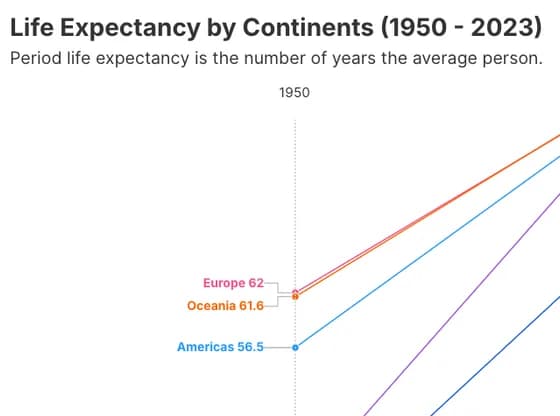 Slope chartLife Expectancy by Continents (1950 - 2023)
 OtherWord Frequency in Trump's Executive Orders
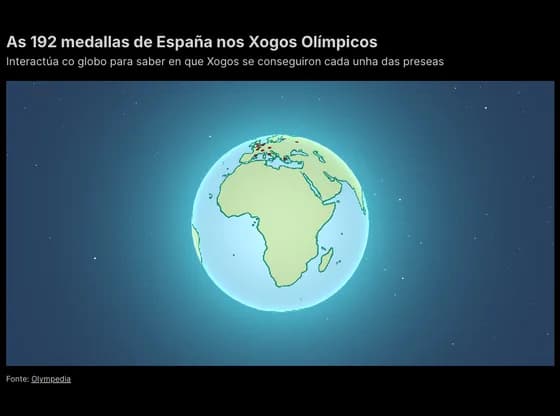 3D globeAs 192 medallas de España nos Xogos Olímpicos
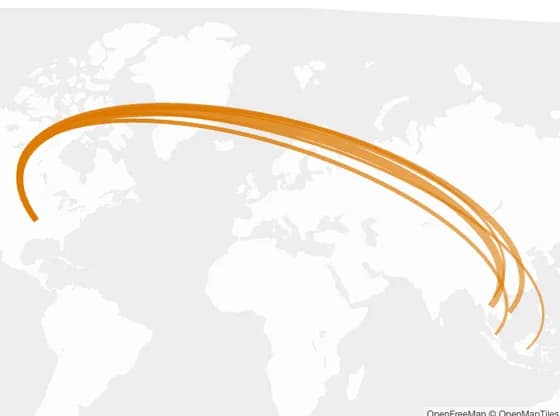 3D mapUS solar panel and solar cell imports during Q4 2024
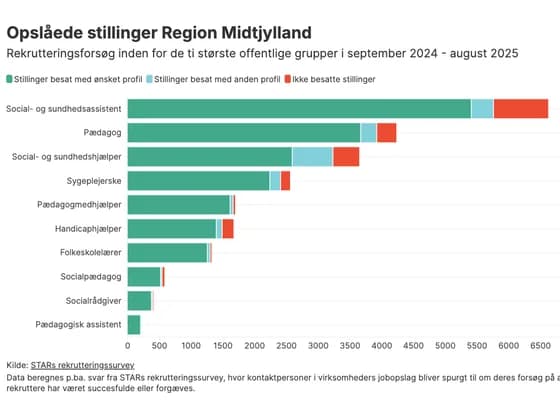 Line, bar and pie chartsOpslåede stillinger Region Midtjylland
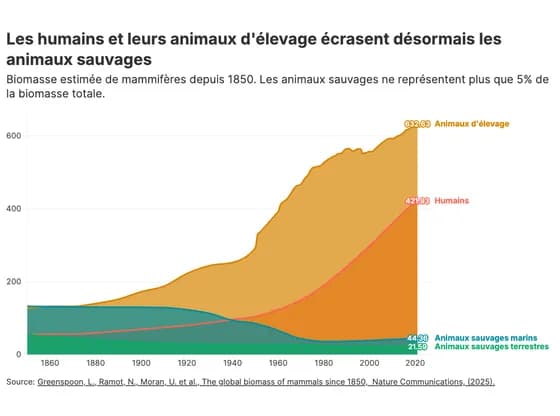 Line, bar and pie chartsLes humains et leurs animaux d'élevage écrasent désormais les animaux sauvages
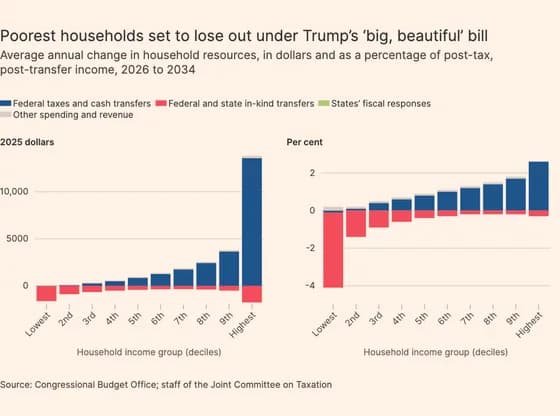 Line, bar and pie chartsPoorest households set to lose out under Trump’s ‘big, beautiful’ bill
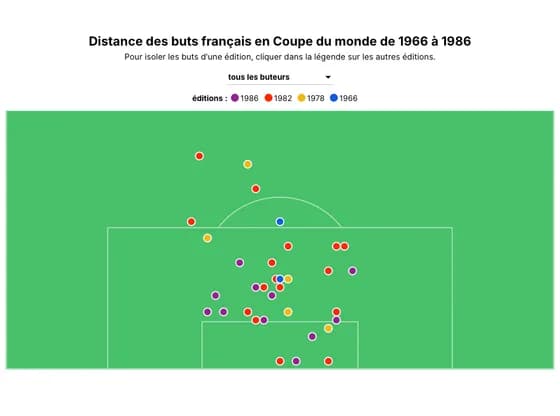 SportsDistance des buts français en Coupe du monde de 1966 à 1986
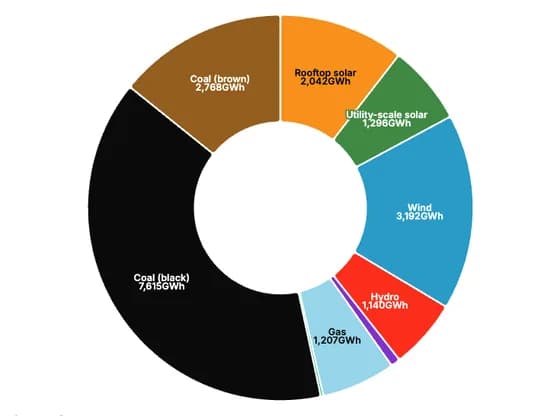 Line, bar and pie chartsContribution to the NEM's generation mix in August 2025