
Jedes Diagramm hier war zuerst eine Tabelle.
Karten, Bar-Chart-Races, Treemaps, Piktogramme und mehr. Eines öffnen und mit eigenen Daten nachbauen.
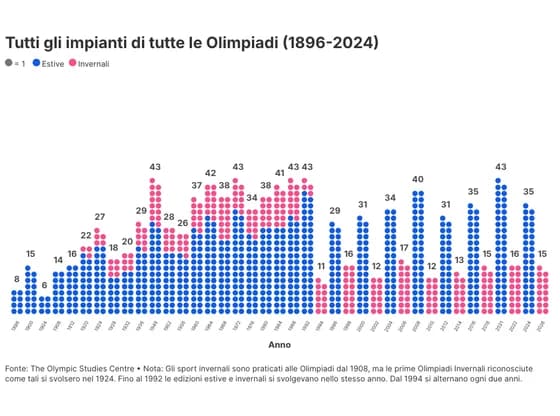 PictogramTutti gli impianti di tutte le Olimpiadi (1896-2024)
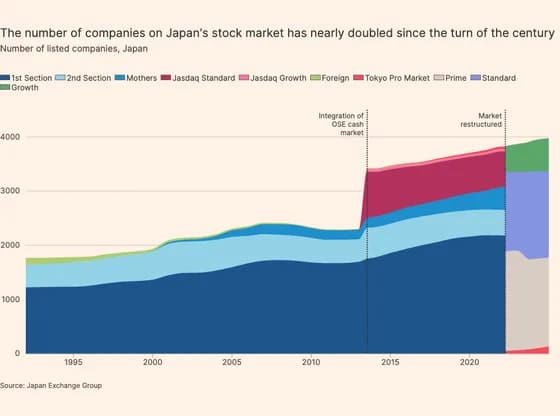 Line, bar and pie chartsThe number of companies on Japan's stock market has nearly doubled since the turn of the century
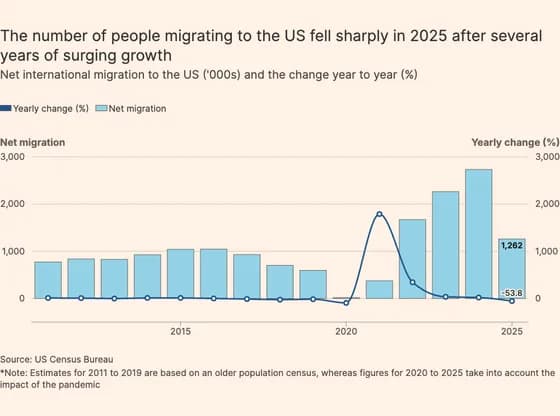 Line, bar and pie chartsThe number of people migrating to the US fell sharply in 2025 after several years of surging growth
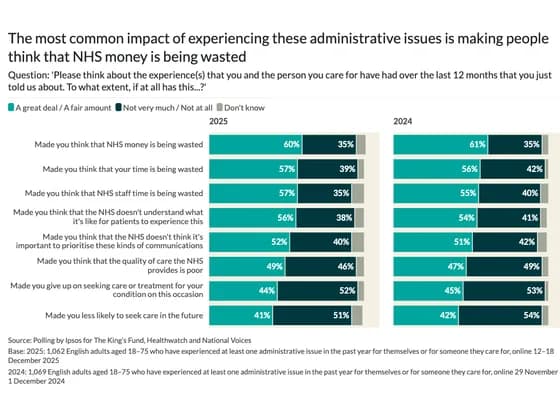 Line, bar and pie chartsThe most common impact of experiencing these administrative issues is making people think that…
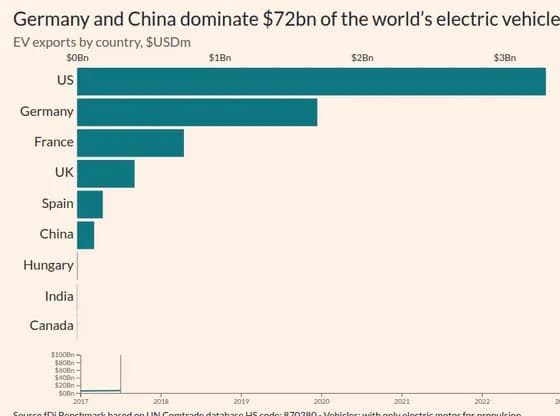 Animated chartsGermany and China dominate $72bn of the world’s electric vehicle exports
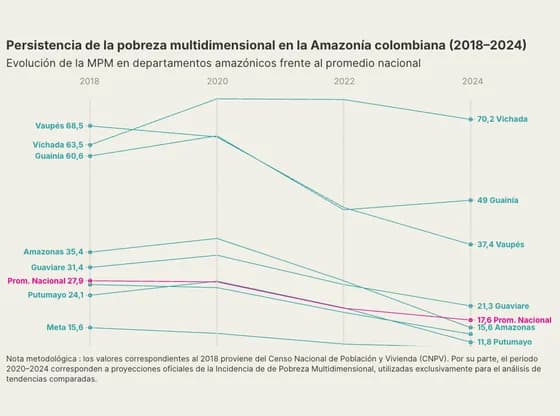 Slope chartPersistencia de la pobreza multidimensional en la Amazonía colombiana (2018–2024)
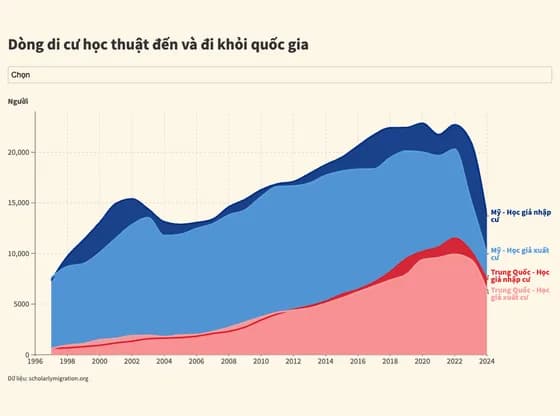 Line, bar and pie chartsDòng di cư học thuật đến và đi khỏi quốc gia
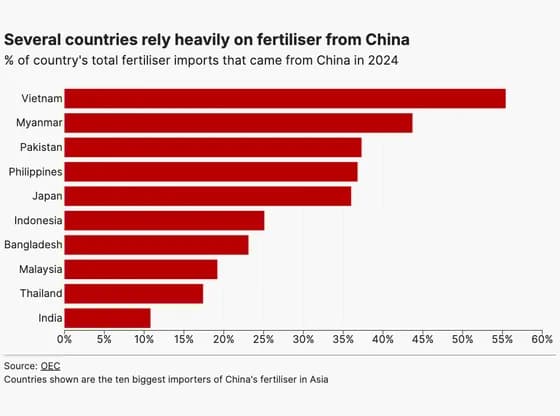 Line, bar and pie chartsSeveral countries rely heavily on fertiliser from China
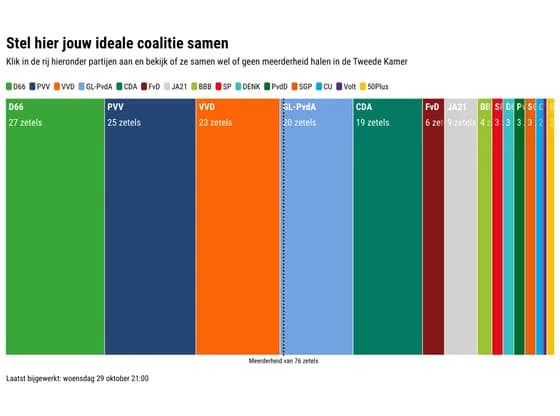 Elections and parliamentsStel hier jouw ideale coalitie samen
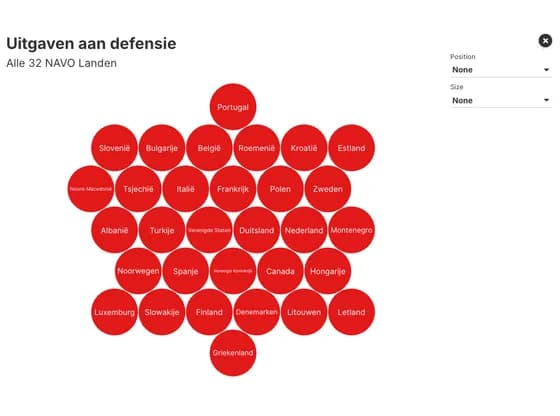 Interactive toolsUitgaven aan defensie
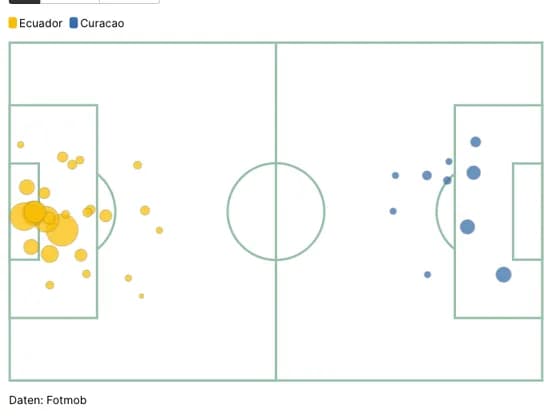 SportsEcuador Chancen vs Curacao
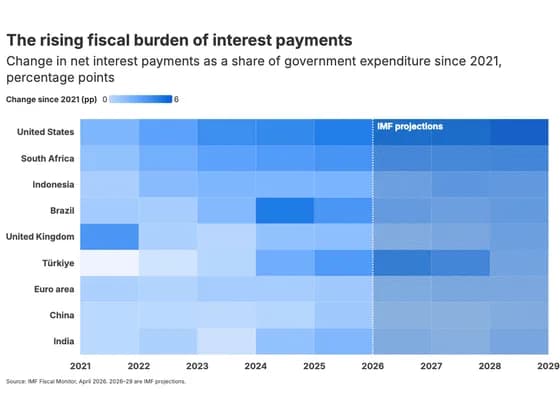 HeatmapThe rising fiscal burden of interest payments
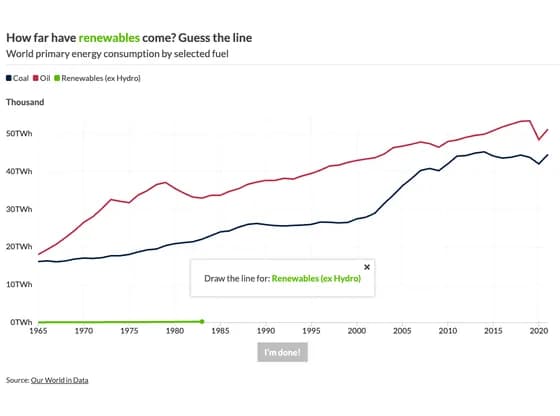 Interactive toolsHow far have renewables come? Guess the line
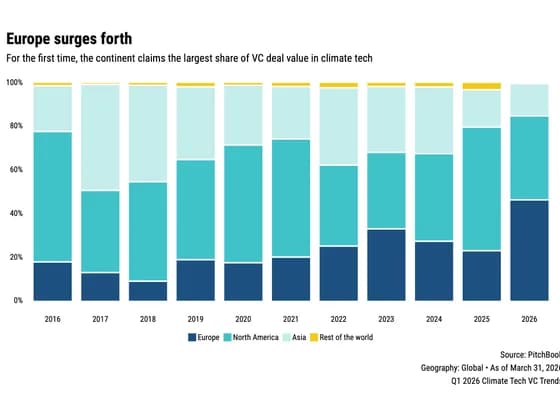 Line, bar and pie chartsEurope surges forth
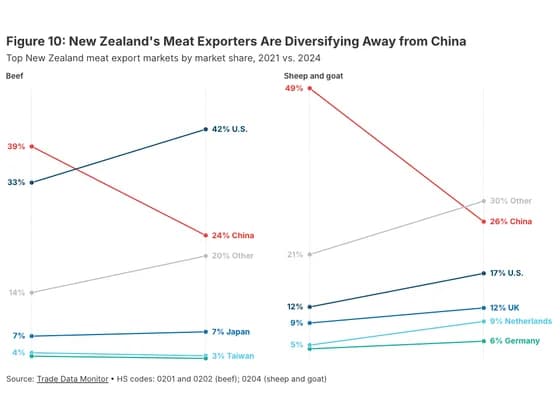 Slope chartFigure 10: New Zealand's Meat Exporters Are Diversifying Away from China
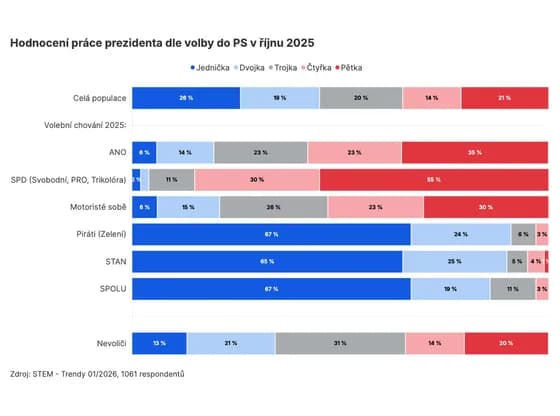 Line, bar and pie chartsHodnocení práce prezidenta dle volby do PS v říjnu 2025
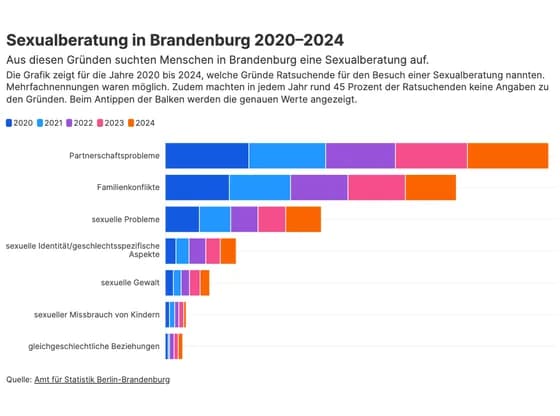 Line, bar and pie chartsSexualberatung in Brandenburg 2020–2024
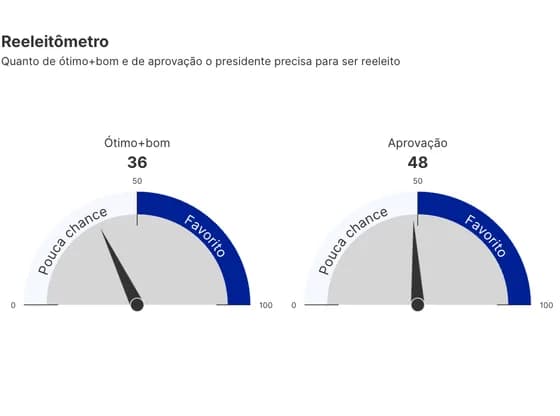 Counters and gaugesReeleitômetro
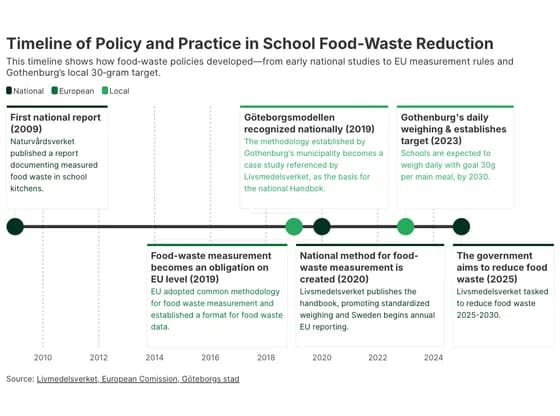 TimelineTimeline of Policy and Practice in School Food‑Waste Reduction
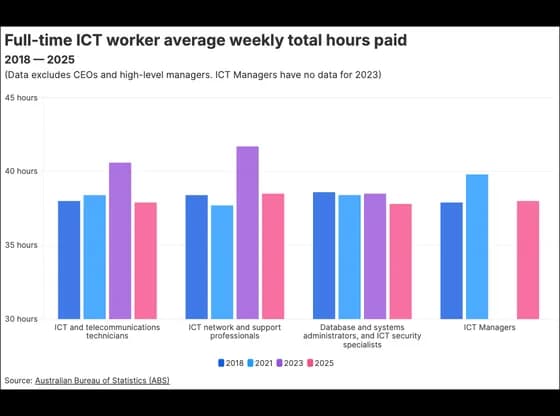 Line, bar and pie chartsFull-time ICT worker average weekly total hours paid