PlotSet LogoPlotSet
Vorlagen

3D-Karte

Karten mit Höhe, Neigung und Satellitenbildern hinter den Daten.

Vorlagen

Starten Sie mit einer dieser Vorlagen und setzen Sie Ihre eigenen Daten ein.

Was ist ein 3D-Karte?

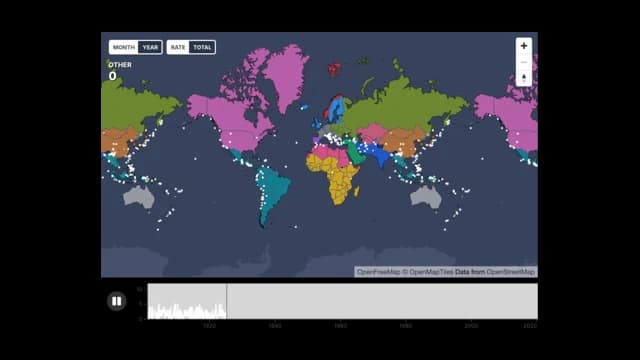
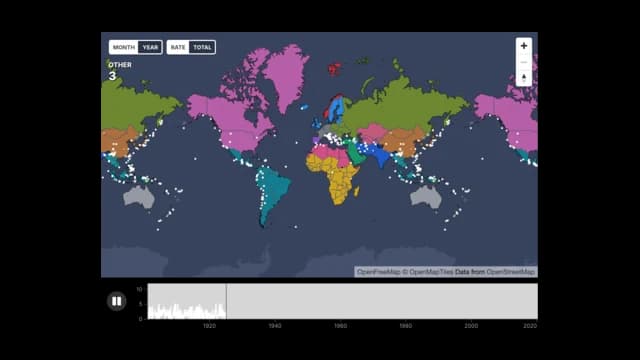
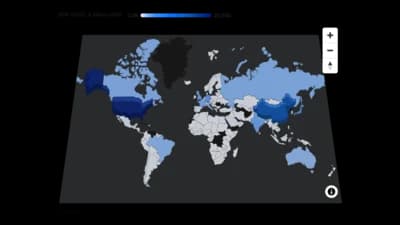
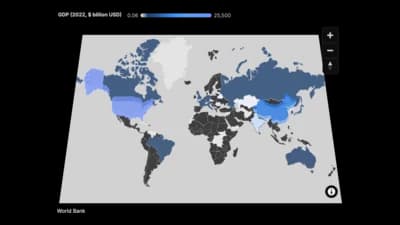
A 3D map is a flat map seen at an angle, so the picture has depth without becoming a true globe. Each row of your data can be a point with a latitude and a longitude, and a country column can raise regions into blocks whose height follows a value. Lines can join places as routes. A timeline can play the points in order, so events appear on the map as their dates arrive. It is drawn as vector graphics with no map tiles, so it exports as a sharp image and works offline.

Wann ein 3D-Karte sinnvoll ist

  • You have events with a place and a date

    Earthquakes, launches and sightings play well on a timeline, and the counter shows the running total.

  • You want depth without a globe

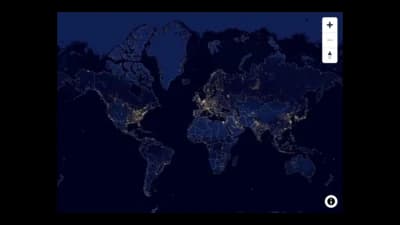
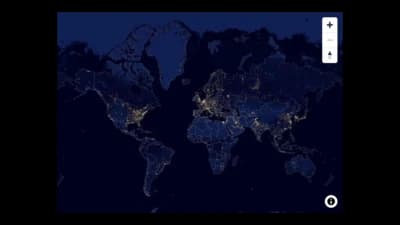
    Tilting the camera makes a world map feel three-dimensional while keeping every continent visible.

  • Countries carry a total

    Raise each country by a value, so height and colour tell the same story at a glance.

  • You need a clean export

    There is no tile server, so the image or video you export matches what the browser shows.

Wann ein 3D-Karte nicht passt

  • You need street-level detail

    The base map is a simplified world outline. Use a tiled marker map for cities and streets.

  • Readers must compare exact values

    Height is read by eye and perspective hides the far side. A bar chart is more precise.

  • Your data is in a single country

    A world view wastes space. A choropleth of that country's regions zooms in closer.

  • The output is a printed page

    Tilt and extrusion are most useful on screen. Print a flat map instead.

3D-Karte erstellen: Schritt für Schritt

Von der Tabelle zum veröffentlichten Diagramm, Schritt für Schritt.

  1. 01Open the 3D Map template
  2. 02Add your rows
  3. 03Bind size, colour and time
  4. 04Set the camera
  5. 05Raise the regions
  6. 06Play and publish

Die Bestandteile eines 3D-Karte

Base map
The land and water outline that sits under your data.
Points
One mark for each row, placed by latitude and longitude.
Raised regions
Countries drawn as blocks whose height follows a value.
Timeline
A play button and a graph of events over time under the map.
Counter
The running count of events up to the playhead.
Popup
A card with a point's details when you click or hover.

Häufige Fehler bei einem 3D-Karte

Using too steep a tilt

Past about sixty degrees the far side is squeezed and hard to read. Keep the pitch moderate.

Expecting the map to play

The timeline needs a column of dates. Without one the map stays still.

Matching country names loosely

Use the English name or the ISO code, or the country will not be raised.

Plotting thousands of points at full size

Dense clusters hide each other. Make the points smaller or cluster them.

3D-Karte: häufige Fragen

A map shown at an angle, with points, raised countries and routes drawn with depth.

Erstellen Sie jetzt Ihr 3D-Karte

Kostenlos starten mit über 600 Vorlagen. Keine Kreditkarte nötig.