使用场景
这类图表最能发挥作用的地方。
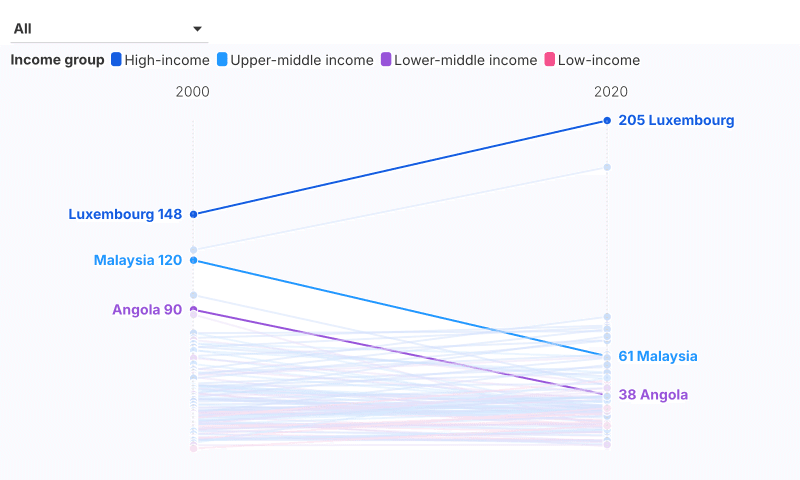
前后排名对比
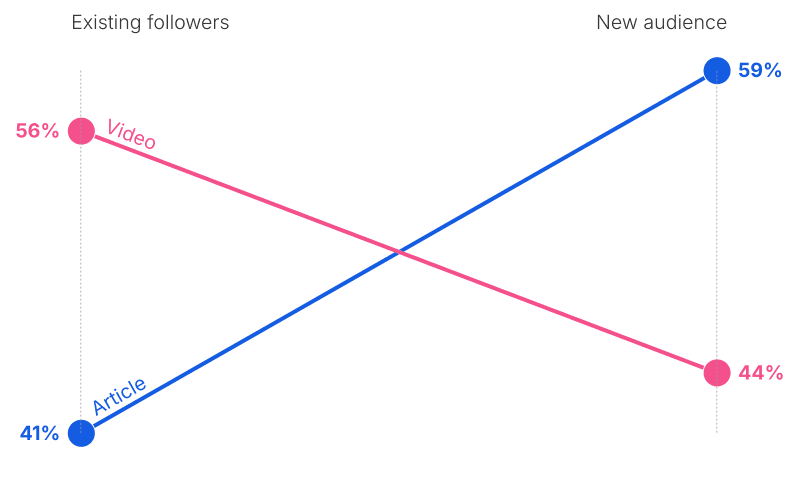
两个年份的调查结果
两个日期的预算或价格
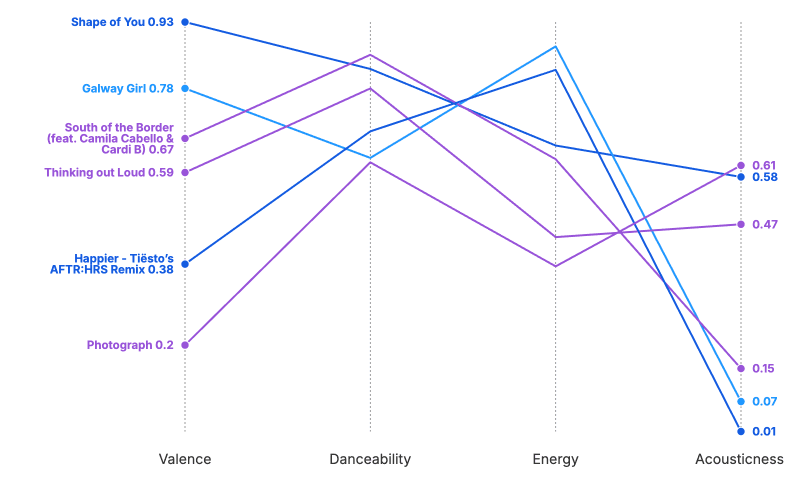
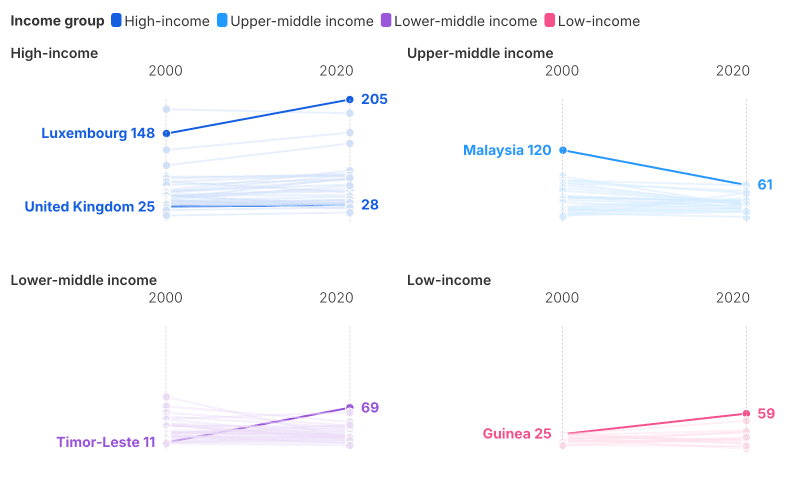
网格中并排的众多斜率
从示例开始
选择一个示例,打开属于你的可编辑副本。
 The Decade of Transition
 Learner Satisfaction
 Doubt resolution and placement support improved, while live session timings saw the steepest drop
 Learner Satisfaction
 Support for the Greens is now lower than this time last year, despite having surged up in spring
 UN membership has nearly quadrupled since 1945
 FIGURE 5 China drove global solar and wind decline in the first half of 2026, investments stable…
 Encuesta preelectoral para las elecciones generales de noviembre de 2019
 Victim race/ethnicity: 2019 - 2022
 Son 14 Yılda Ülkelere Göre Yolsuzlık Algısının Değişimi
 Disasters in the South, money in the Southeast
 FIGURE 2 US greenhouse gas emissions by sector, under current policy