
使用场景
这类图表最能发挥作用的地方。
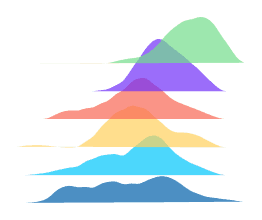
比较各组之间某项指标的离散程度
发现分布中的双峰
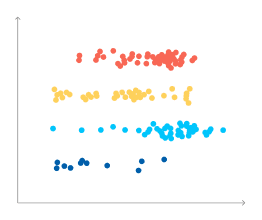
用蜂群图显示每一个数据点
按类别划分的得分、时间或价格
从示例开始
选择一个示例,打开属于你的可编辑副本。
 I pomodori che compriamo all'estero
 Quanto pesano gli incidenti nella divisione dei fondi
 Installed capacity of global power plants financed by Chinese foreign direct investment and/or…
 Il passaparola che ha portato i giovani in piazza
 Distribution of NYC Dog Runs by Community Board
 The role of AI and humans in customers lives
 Percentage of grants disbursed by region, 2025
 Median value of public AI-related contracts in select European countries
 If Languages were States...
 Rank the most popular players in the Premier League 2025
 The 2025 AGM season
 Who Pays for Maternity Leave in 2025?